4000 100 80 20 3284 % of base peak IR Spectrum (KBr disc) 3000 Japan 13C NMR Spectrum 2000 1658 1600 43 106 WAIT 137 40 80 120 160 m/e V (cm¹) M** 179 200 1200 800 Mass Spectrum C10H13 NO2 240 280 UV Spectrum max 250 nm (log, 3.1) Amax 287 nm (log₁0€ 2.2) solvent: chloroform
4000 100 80 20 3284 % of base peak IR Spectrum (KBr disc) 3000 Japan 13C NMR Spectrum 2000 1658 1600 43 106 WAIT 137 40 80 120 160 m/e V (cm¹) M** 179 200 1200 800 Mass Spectrum C10H13 NO2 240 280 UV Spectrum max 250 nm (log, 3.1) Amax 287 nm (log₁0€ 2.2) solvent: chloroform

Chapter13: Structure Determination: Nuclear Magnetic Resonance Spectroscopy
Section13.SE: Something Extra
Problem 59GP: The mass spectrum and 13C NMR spectrum of a hydrocarbon are shown. Propose a structure for this...

Related questions
Question
100%
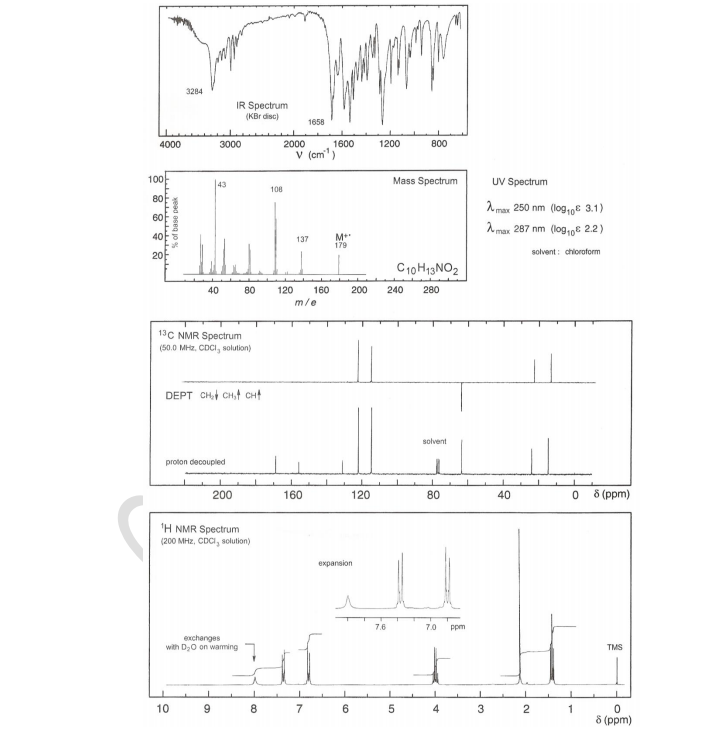
From the IR, MS, UV, 13C NMR and 1H NMR data shown below, identify the unknown organic molecule. Indicate any partial structures that you are able to deduce from these spectra and explain how you identify these.
Transcribed Image Text:4000
100
80
20
3284
% of base peak
3000
43
40
10
13C NMR Spectrum
(50.0 MHz, CDCI, solution)
IR Spectrum
(KBr disc)
106
MMM.
137
80
120 160
m/e
DEPT CH₂ CH₂ CH
proton decoupled
9
200
¹H NMR Spectrum
(200 MHz, CDCI, solution)
exchanges
with D₂O on warming
2000
8
1658
V (cm¹)
160
1600
7
M**
179
200
6
120
expansion
1200
7.6
800
Mass Spectrum
C10H13 NO2
240 280
5
solvent
80
7.0
4
ppm
3
UV Spectrum
max 250 nm (log, 3.1)
Amax 287 nm (log₁0€ 2.2)
solvent: chloroform
40
2
0
1
8 (ppm)
TMS
0
8 (ppm)
Expert Solution
This question has been solved!
Explore an expertly crafted, step-by-step solution for a thorough understanding of key concepts.

Step by step
Solved in 2 steps with 1 images

Knowledge Booster


Learn more about
Need a deep-dive on the concept behind this application? Look no further. Learn more about this topic, chemistry and related others by exploring similar questions and additional content below.Recommended textbooks for you

Macroscale and Microscale Organic Experiments
Chemistry
ISBN:
9781305577190
Author:
Kenneth L. Williamson, Katherine M. Masters
Publisher:
Brooks Cole
Macroscale and Microscale Organic Experiments
Chemistry
ISBN:
9781305577190
Author:
Kenneth L. Williamson, Katherine M. Masters
Publisher:
Brooks Cole