42. From the following data, calculate the median and the first and third quartile wages: No. of Weekly wages (Rs.) No. of workers Weekly wages (Rs.) workers 62 39 20 30-32 2 40-42 32-34 9. 42-44 25 30 44-46 46-48 34-36 11 36-38 49 48-50 3. 38-40 58
42. From the following data, calculate the median and the first and third quartile wages: No. of Weekly wages (Rs.) No. of workers Weekly wages (Rs.) workers 62 39 20 30-32 2 40-42 32-34 9. 42-44 25 30 44-46 46-48 34-36 11 36-38 49 48-50 3. 38-40 58

Glencoe Algebra 1, Student Edition, 9780079039897, 0079039898, 2018
18th Edition
ISBN:9780079039897
Author:Carter
Publisher:Carter
Chapter10: Statistics
Section10.5: Comparing Sets Of Data
Problem 2GP

Related questions
Question
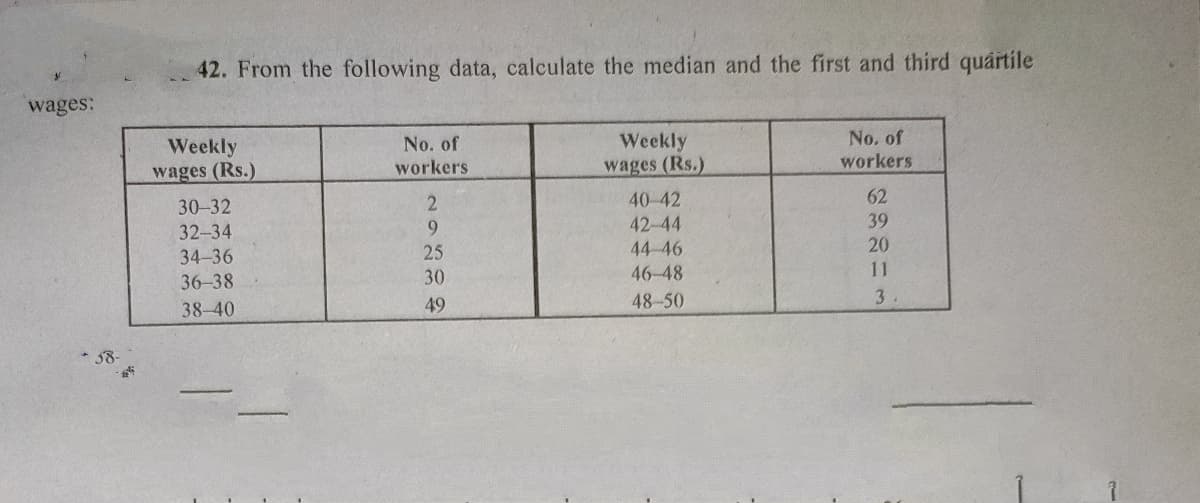
Transcribed Image Text:42. From the following data, calculate the median and the first and third quartile
wages:
No. of
No. of
workers
Weekly
wages (Rs.)
Weekly
workers
wages (Rs.)
40-42
62
30-32
9.
42-44
39
32-34
20
11
34-36
25
44-46
36-38
30
46-48
49
48-50
3
38-40
* 58-
Expert Solution
This question has been solved!
Explore an expertly crafted, step-by-step solution for a thorough understanding of key concepts.

Step by step
Solved in 2 steps with 2 images

Recommended textbooks for you
Glencoe Algebra 1, Student Edition, 9780079039897…
Algebra
ISBN:
9780079039897
Author:
Carter
Publisher:
McGraw Hill
Glencoe Algebra 1, Student Edition, 9780079039897…
Algebra
ISBN:
9780079039897
Author:
Carter
Publisher:
McGraw Hill