5. A solution of 0.100 MHCI and a solution of 0.100 M NGOH 14 are prepared. A 40.0 mL sample of one of the solutions is added to a beaker and then titrated with the other solution. A 12 pH electrode is used to obtain the data that are plotted in the 10 titration curve shown. pH 6. a. Identify the solution that was initially added to the beaker and which solution was in the buret. Explain your reasoning. 4. b. At the equivalence point, how many moles of titrant have been added? 20.0 40.0 60.0 80.0 Volume of Titrant Added (mL.) c. The same titration is to be performed again, this time using an indicator. Use the information in the table below to select the best indicator for the titration. Explain your choice. pH Range of Color Change Indicator Methyl violet 0-1.6
5. A solution of 0.100 MHCI and a solution of 0.100 M NGOH 14 are prepared. A 40.0 mL sample of one of the solutions is added to a beaker and then titrated with the other solution. A 12 pH electrode is used to obtain the data that are plotted in the 10 titration curve shown. pH 6. a. Identify the solution that was initially added to the beaker and which solution was in the buret. Explain your reasoning. 4. b. At the equivalence point, how many moles of titrant have been added? 20.0 40.0 60.0 80.0 Volume of Titrant Added (mL.) c. The same titration is to be performed again, this time using an indicator. Use the information in the table below to select the best indicator for the titration. Explain your choice. pH Range of Color Change Indicator Methyl violet 0-1.6

Chapter22: Bulk Electrolysis: Electrogravimetry And Coulometry
Section: Chapter Questions
Problem 22.26QAP

Related questions
Question
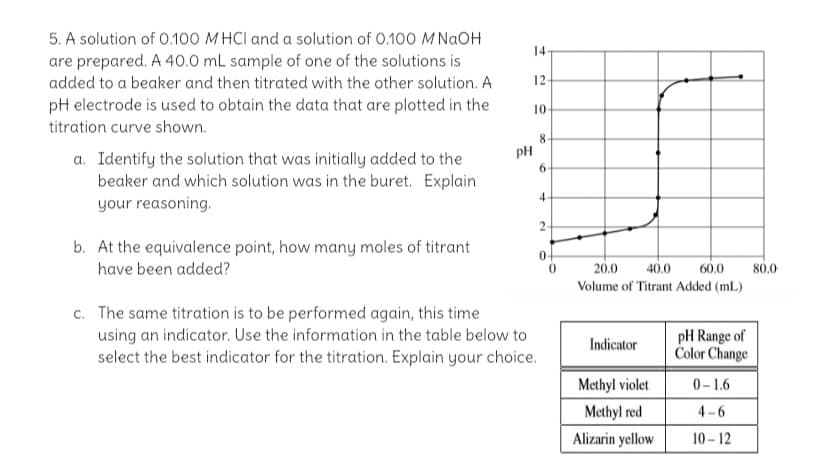
Transcribed Image Text:5. A solution of 0.100 M HCI and a solution of 0.100 M NAOH
14
are prepared. A 40.0 mL sample of one of the solutions is
added to a beaker and then titrated with the other solution. A
12
pH electrode is used to obtain the data that are plotted in the
10
titration curve shown.
8.
pH
a. Identify the solution that was initially added to the
beaker and which solution was in the buret. Explain
your reasoning.
6.
2
b. At the equivalence point, how many moles of titrant
0-
have been added?
20.0
40.0
60.0
80.0
Volume of Titrant Added (mL)
c. The same titration is to be performed again, this time
using an indicator. Use the information in the table below to
select the best indicator for the titration. Explain your choice.
pH Range of
Color Change
Indicator
Methyl violet
0-1.6
Methyl red
4-6
Alizarin yellow
10 - 12
Expert Solution
This question has been solved!
Explore an expertly crafted, step-by-step solution for a thorough understanding of key concepts.

This is a popular solution!

Trending now
This is a popular solution!

Step by step
Solved in 2 steps with 1 images

Knowledge Booster


Learn more about
Need a deep-dive on the concept behind this application? Look no further. Learn more about this topic, chemistry and related others by exploring similar questions and additional content below.Recommended textbooks for you

Chemical Principles in the Laboratory
Chemistry
ISBN:
9781305264434
Author:
Emil Slowinski, Wayne C. Wolsey, Robert Rossi
Publisher:
Brooks Cole

Chemistry: The Molecular Science
Chemistry
ISBN:
9781285199047
Author:
John W. Moore, Conrad L. Stanitski
Publisher:
Cengage Learning
Chemical Principles in the Laboratory
Chemistry
ISBN:
9781305264434
Author:
Emil Slowinski, Wayne C. Wolsey, Robert Rossi
Publisher:
Brooks Cole
Chemistry: The Molecular Science
Chemistry
ISBN:
9781285199047
Author:
John W. Moore, Conrad L. Stanitski
Publisher:
Cengage Learning

Principles of Modern Chemistry
Chemistry
ISBN:
9781305079113
Author:
David W. Oxtoby, H. Pat Gillis, Laurie J. Butler
Publisher:
Cengage Learning

Principles of Instrumental Analysis
Chemistry
ISBN:
9781305577213
Author:
Douglas A. Skoog, F. James Holler, Stanley R. Crouch
Publisher:
Cengage Learning

Chemistry: An Atoms First Approach
Chemistry
ISBN:
9781305079243
Author:
Steven S. Zumdahl, Susan A. Zumdahl
Publisher:
Cengage Learning