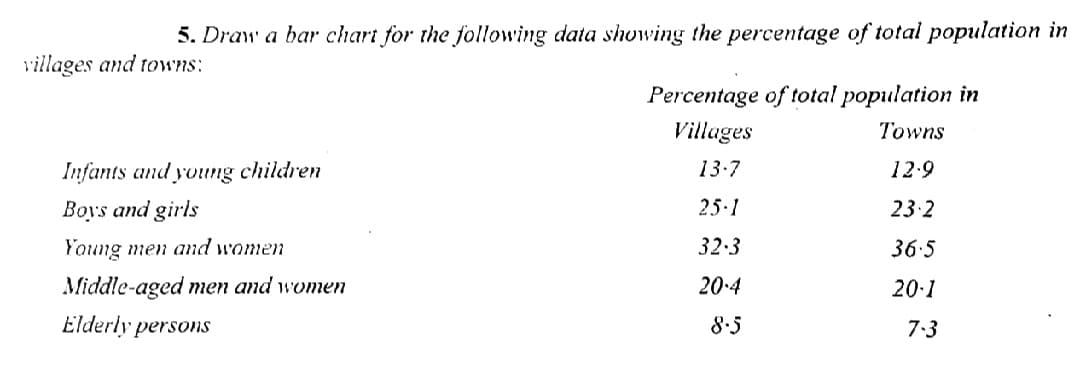
5. Draw a bar chart for the following data showing the percentage of total population in villages and towns: Percentage of total population in Villages Towns Infants and young children 13-7 12.9 Boys and girls 25.1 23.2 Young men and women 32.3 36.5 Middle-aged men and women 20.4 20.1 Elderly persons 8.5 7:3
5. Draw a bar chart for the following data showing the percentage of total population in villages and towns: Percentage of total population in Villages Towns Infants and young children 13-7 12.9 Boys and girls 25.1 23.2 Young men and women 32.3 36.5 Middle-aged men and women 20.4 20.1 Elderly persons 8.5 7:3

Glencoe Algebra 1, Student Edition, 9780079039897, 0079039898, 2018
18th Edition
ISBN:9780079039897
Author:Carter
Publisher:Carter
Chapter10: Statistics
Section10.6: Summarizing Categorical Data
Problem 24PPS

Related questions
Question
Transcribed Image Text:5. Draw a bar chart for the following data showing the percentage of total population in
villages and towns:
Percentage of total population in
Villages
Towns
Infants and young children
13-7
12.9
Boys and girls
25.1
23.2
Young men and women
32.3
36.5
Middle-aged men and women
20.4
20.1
Elderly persons
8.5
7:3
Expert Solution
This question has been solved!
Explore an expertly crafted, step-by-step solution for a thorough understanding of key concepts.

This is a popular solution!

Trending now
This is a popular solution!

Step by step
Solved in 4 steps with 4 images

Recommended textbooks for you
Glencoe Algebra 1, Student Edition, 9780079039897…
Algebra
ISBN:
9780079039897
Author:
Carter
Publisher:
McGraw Hill
Glencoe Algebra 1, Student Edition, 9780079039897…
Algebra
ISBN:
9780079039897
Author:
Carter
Publisher:
McGraw Hill