1. Construct a pie chart for the following infor Type of Frequene Car BMW y 15 Relative Percent Frequency Jaguar Mercede 6. 8. Station Wagon Cadillac 10 Other 18 Total
1. Construct a pie chart for the following infor Type of Frequene Car BMW y 15 Relative Percent Frequency Jaguar Mercede 6. 8. Station Wagon Cadillac 10 Other 18 Total

A First Course in Probability (10th Edition)
10th Edition
ISBN:9780134753119
Author:Sheldon Ross
Publisher:Sheldon Ross
Chapter1: Combinatorial Analysis
Section: Chapter Questions
Problem 1.1P: a. How many different 7-place license plates are possible if the first 2 places are for letters and...

Related questions
Question
Transcribed Image Text:ued do
om/c/MZC30TMXODQWODU4/m/MzkwNjc4MDExMTUX/details
Cpen w th
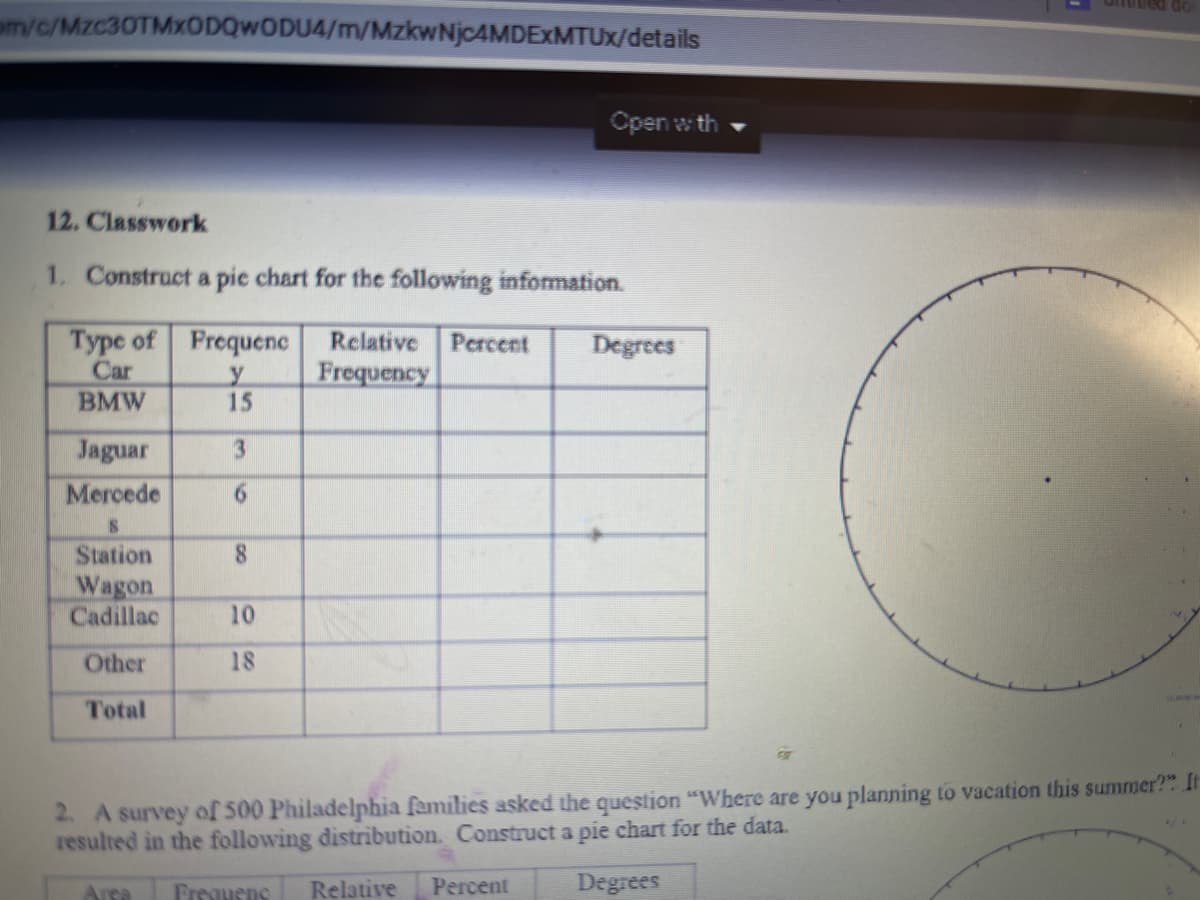
12. Classwork
1. Construct a pie chart for the following information.
Type of Frequene
Car
Relative Percent
Frequency
Degrees
BMW
15
Jaguar
3.
Mercede
9.
Station
Wagon
Cadillac
8.
10
Other
18
Total
2. A survey of 500 Philadelphia families asked the question "Where are you planning to vacation this summer?". It
resulted in the following distribution. Construct a pie chart for the data.
Area
Frequenc
Relative
Percent
Degrees
Expert Solution
This question has been solved!
Explore an expertly crafted, step-by-step solution for a thorough understanding of key concepts.

This is a popular solution!

Trending now
This is a popular solution!

Step by step
Solved in 2 steps with 2 images

Recommended textbooks for you
A First Course in Probability (10th Edition)
Probability
ISBN:
9780134753119
Author:
Sheldon Ross
Publisher:
PEARSON

A First Course in Probability (10th Edition)
Probability
ISBN:
9780134753119
Author:
Sheldon Ross
Publisher:
PEARSON