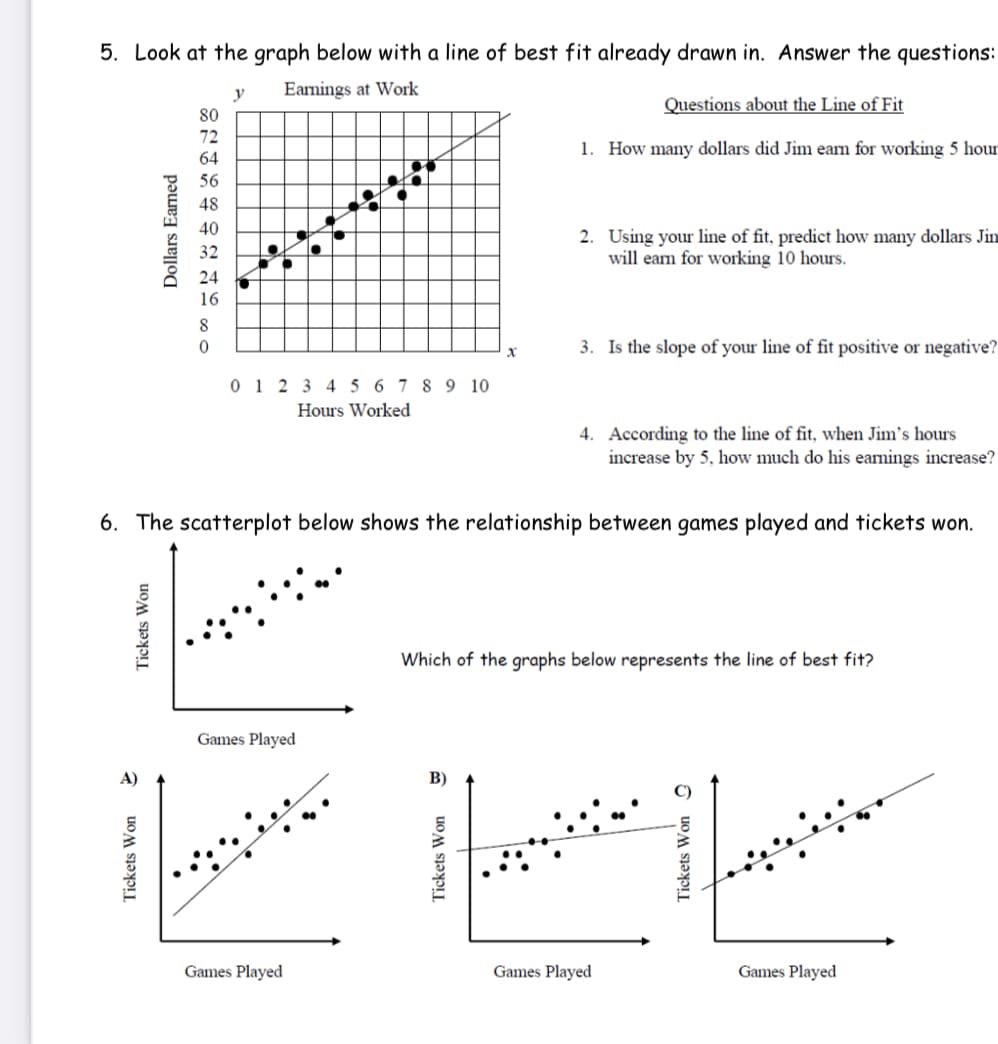
5. Look at the graph below with a line of best fit already drawn in. Answer the questions: y Eamings at Work Questions about the Line of Fit 80 72 1. How many dollars did Jim eam for working 5 hour 64 56 48 40 2. Using your line of fit, predict how many dollars Jin will eam for working 10 hours. 32 24 8 3. Is the slope of your line of fit positive or negative? 0 1 2 3 4 5 6 7 8 9 10 Hours Worked According to the line of fit, when Jim's hours Dollars Earned

Algebra: Structure And Method, Book 1
(REV)00th Edition
ISBN:9780395977224
Author:Richard G. Brown, Mary P. Dolciani, Robert H. Sorgenfrey, William L. Cole
Publisher:Richard G. Brown, Mary P. Dolciani, Robert H. Sorgenfrey, William L. Cole
Chapter8: Introduction To Functions
Section8.6: Functions Defined By Tables And Graphs
Problem 7WE
icon
Related questions
Topic Video
Question

5,6

5. Look at the graph below with a line of best fit already drawn in. Answer the questions:
y
Earnings at Work
Questions about the Line of Fit
80
72
1. How many dollars did Jim eam for working 5 hour
64
56
48
40
2. Using your line of fit, predict how many dollars Jin
will earn for working 10 hours.
32
24
16
8
3. Is the slope of your line of fit positive or negative?
0 1 2 3 4 5 6 7 8 9 10
Hours Worked
4. According to the line of fit, when Jim's hours
increase by 5, how much do his eamings increase?
6. The scatterplot below shows the relationship between games played and tickets won.
Which of the graphs below represents the line of best fit?
Games Played
A)
B)
Games Played
Games Played
Games Played
Tickets Won
Dollars Earned
Transcribed Image Text:5. Look at the graph below with a line of best fit already drawn in. Answer the questions: y Earnings at Work Questions about the Line of Fit 80 72 1. How many dollars did Jim eam for working 5 hour 64 56 48 40 2. Using your line of fit, predict how many dollars Jin will earn for working 10 hours. 32 24 16 8 3. Is the slope of your line of fit positive or negative? 0 1 2 3 4 5 6 7 8 9 10 Hours Worked 4. According to the line of fit, when Jim's hours increase by 5, how much do his eamings increase? 6. The scatterplot below shows the relationship between games played and tickets won. Which of the graphs below represents the line of best fit? Games Played A) B) Games Played Games Played Games Played Tickets Won Dollars Earned
Expert Solution
trending now

Trending now

This is a popular solution!

steps

Step by step

Solved in 2 steps with 1 images

Blurred answer
Knowledge Booster
Algebraic Operations
Learn more about
Need a deep-dive on the concept behind this application? Look no further. Learn more about this topic, algebra and related others by exploring similar questions and additional content below.
Recommended textbooks for you
Algebra: Structure And Method, Book 1
Algebra
ISBN:
9780395977224
Author:
Richard G. Brown, Mary P. Dolciani, Robert H. Sorgenfrey, William L. Cole
Publisher:
McDougal Littell
Holt Mcdougal Larson Pre-algebra: Student Edition…
Algebra
ISBN:
9780547587776
Author:
HOLT MCDOUGAL
Publisher:
HOLT MCDOUGAL
PREALGEBRA
PREALGEBRA
Algebra
ISBN:
9781938168994
Author:
OpenStax
Publisher:
OpenStax