5. Omitting relevant regressors from the model results in OLS estimators that are: a. biased but more precise. b. are both unbiased and more efficient. c. both biased and less efficient. d. None of the above
5. Omitting relevant regressors from the model results in OLS estimators that are: a. biased but more precise. b. are both unbiased and more efficient. c. both biased and less efficient. d. None of the above

Glencoe Algebra 1, Student Edition, 9780079039897, 0079039898, 2018
18th Edition
ISBN:9780079039897
Author:Carter
Publisher:Carter
Chapter4: Equations Of Linear Functions
Section4.6: Regression And Median-fit Lines
Problem 4GP

Related questions
Question
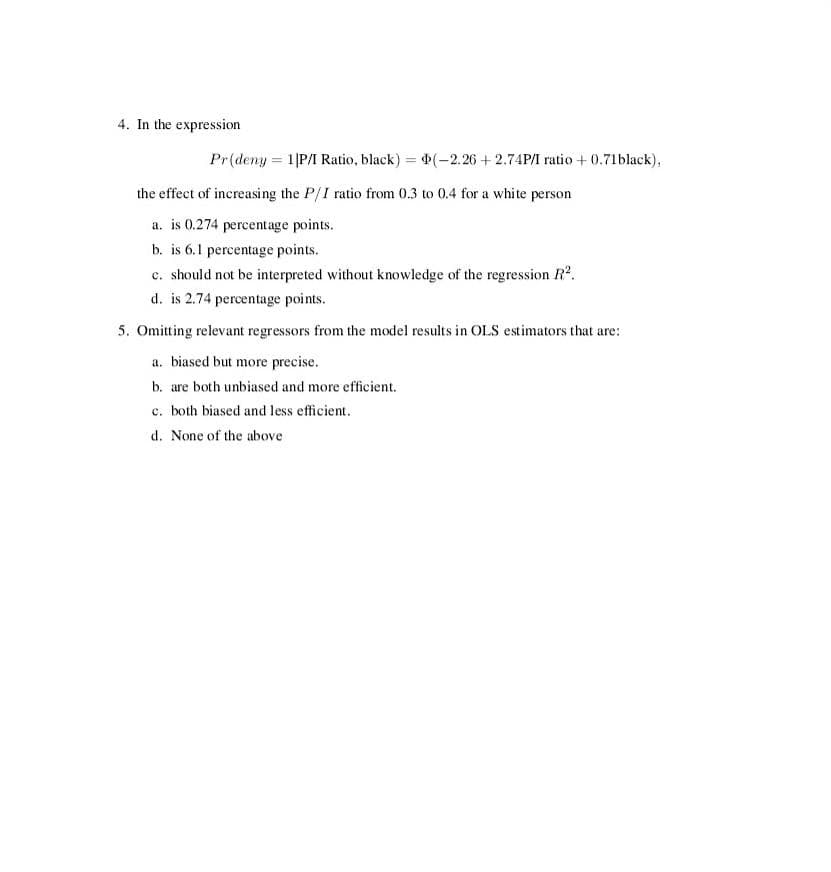
Transcribed Image Text:4. In the expression
Pr(deny = 1|P/I Ratio, black) = (-2.26 +2.74P/I ratio + 0.71black),
the effect of increasing the P/I ratio from 0.3 to 0.4 for a white person
a. is 0.274 percentage points.
b. is 6.1 percentage points.
c. should not be interpreted without knowledge of the regression R².
d. is 2.74 percentage points.
5. Omitting relevant regressors from the model results in OLS estimators that are:
a. biased but more precise.
b. are both unbiased and more efficient.
c. both biased and less efficient.
d. None of the above
Expert Solution
This question has been solved!
Explore an expertly crafted, step-by-step solution for a thorough understanding of key concepts.

Step by step
Solved in 2 steps

Recommended textbooks for you
Glencoe Algebra 1, Student Edition, 9780079039897…
Algebra
ISBN:
9780079039897
Author:
Carter
Publisher:
McGraw Hill

College Algebra
Algebra
ISBN:
9781305115545
Author:
James Stewart, Lothar Redlin, Saleem Watson
Publisher:
Cengage Learning
Glencoe Algebra 1, Student Edition, 9780079039897…
Algebra
ISBN:
9780079039897
Author:
Carter
Publisher:
McGraw Hill
College Algebra
Algebra
ISBN:
9781305115545
Author:
James Stewart, Lothar Redlin, Saleem Watson
Publisher:
Cengage Learning