5. The graph below shows the LFPR for 25-54 year old men over several decades. Percent 100 May-16 98 96 94 92 90 88 86 1948 1954 1960 1966 1972 1978 1984 1990 1996 2002 2008 2014 Source: Bureau of Labor Statistics, Current Population Survey; CEA calculations. (Source: Voxeu.org) It shows that the fraction of these "prime working age men" who are NOT in the labor forced h a. doubled b. tripled c. quadrupled d. not changed
5. The graph below shows the LFPR for 25-54 year old men over several decades. Percent 100 May-16 98 96 94 92 90 88 86 1948 1954 1960 1966 1972 1978 1984 1990 1996 2002 2008 2014 Source: Bureau of Labor Statistics, Current Population Survey; CEA calculations. (Source: Voxeu.org) It shows that the fraction of these "prime working age men" who are NOT in the labor forced h a. doubled b. tripled c. quadrupled d. not changed

Glencoe Algebra 1, Student Edition, 9780079039897, 0079039898, 2018
18th Edition
ISBN:9780079039897
Author:Carter
Publisher:Carter
Chapter10: Statistics
Section10.2: Representing Data
Problem 22PFA

Related questions
Question
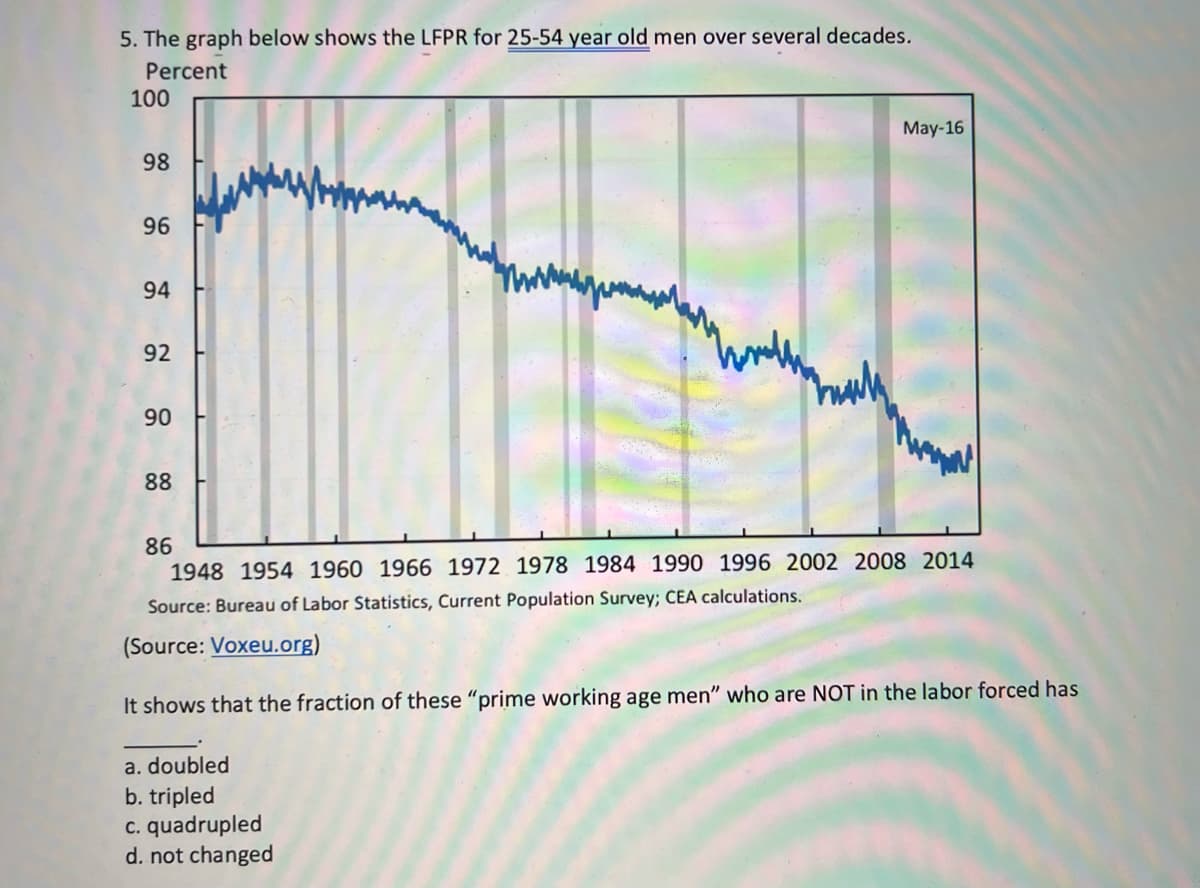
Transcribed Image Text:5. The graph below shows the LFPR for 25-54 year old men over several decades.
Percent
100
May-16
98
96
94
92
90
88
86
1948 1954 1960 1966 1972 1978 1984 1990 1996 2002 2008 2014
Source: Bureau of Labor Statistics, Current Population Survey; CEA calculations.
(Source: Voxeu.org)
It shows that the fraction of these "prime working age men" who are NOT in the labor forced has
a. doubled
b. tripled
c. quadrupled
d. not changed
Expert Solution
This question has been solved!
Explore an expertly crafted, step-by-step solution for a thorough understanding of key concepts.

This is a popular solution!

Trending now
This is a popular solution!

Step by step
Solved in 2 steps

Recommended textbooks for you
Glencoe Algebra 1, Student Edition, 9780079039897…
Algebra
ISBN:
9780079039897
Author:
Carter
Publisher:
McGraw Hill
Glencoe Algebra 1, Student Edition, 9780079039897…
Algebra
ISBN:
9780079039897
Author:
Carter
Publisher:
McGraw Hill