*5.7 $uppose the demand and supp United States are given by the following equations: = 100 – 2OP Q = 10 + 40P %3D = millions of dozens of eggs Americans would = millions of dozens of eggs where Qá like to buy each year; Q, U.S. farms would like to sell each year; and P = price per dozen eggs. a. Fill in the following table: Quantity Demanded (Qa) Quantity Supplied (Q.) Price (Per Dozen) $ 50 $ 1.00 $ 1.50 $ 2.00 $ 2.50 b. Use the information in the table to find the equilibrium price and quantity. c. Graph the demand and supply curves and identify the equilibrium price and quantity.
*5.7 $uppose the demand and supp United States are given by the following equations: = 100 – 2OP Q = 10 + 40P %3D = millions of dozens of eggs Americans would = millions of dozens of eggs where Qá like to buy each year; Q, U.S. farms would like to sell each year; and P = price per dozen eggs. a. Fill in the following table: Quantity Demanded (Qa) Quantity Supplied (Q.) Price (Per Dozen) $ 50 $ 1.00 $ 1.50 $ 2.00 $ 2.50 b. Use the information in the table to find the equilibrium price and quantity. c. Graph the demand and supply curves and identify the equilibrium price and quantity.

Principles of Economics 2e
2nd Edition
ISBN:9781947172364
Author:Steven A. Greenlaw; David Shapiro
Publisher:Steven A. Greenlaw; David Shapiro
Chapter1: Welcome To Economics!
Section: Chapter Questions
Problem 6SCQ: Suppose we extend the circular flow model to add imports and exports. Copy the circular flow diagram...

Related questions
Question
Can I get some help on these questions please?
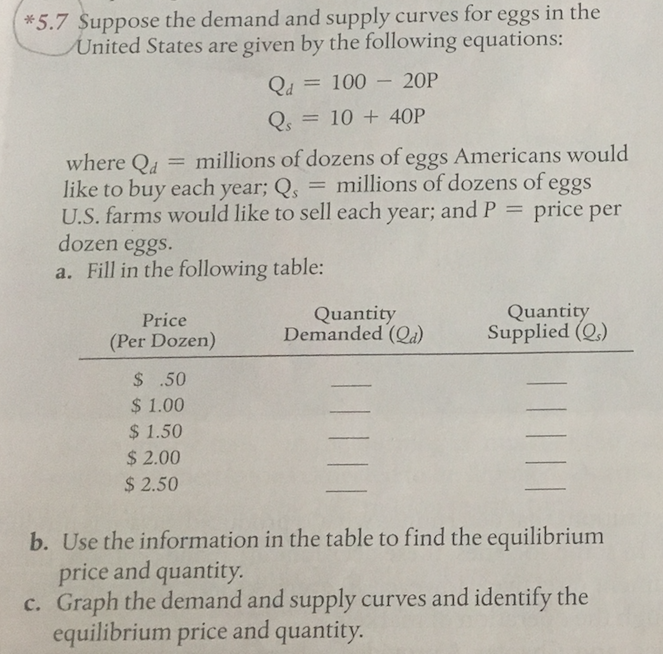
Transcribed Image Text:*5.7 $uppose the demand and supply curves for eggs in the
United States are given by the following equations:
Qd = 100 – 20P
Qs
= 10 + 4OP
= millions of dozens of eggs Americans would
where Qd
like to buy each year; Q, = millions of dozens of eggs
U.S. farms would like to sell each year; and P =
dozen eggs.
a. Fill in the following table:
price per
Quantity
Demanded (Qa)
Quantity
Supplied (Q.)
Price
(Per Dozen)
$ 50
$ 1.00
$ 1.50
$ 2.00
$ 2.50
b. Use the information in the table to find the equilibrium
price and quantity.
c. Graph the demand and supply curves and identify the
equilibrium price and quantity.
Expert Solution
This question has been solved!
Explore an expertly crafted, step-by-step solution for a thorough understanding of key concepts.

This is a popular solution!

Trending now
This is a popular solution!

Step by step
Solved in 3 steps

Knowledge Booster


Learn more about
Need a deep-dive on the concept behind this application? Look no further. Learn more about this topic, economics and related others by exploring similar questions and additional content below.Recommended textbooks for you
Principles of Economics 2e
Economics
ISBN:
9781947172364
Author:
Steven A. Greenlaw; David Shapiro
Publisher:
OpenStax

Principles of Economics 2e
Economics
ISBN:
9781947172364
Author:
Steven A. Greenlaw; David Shapiro
Publisher:
OpenStax