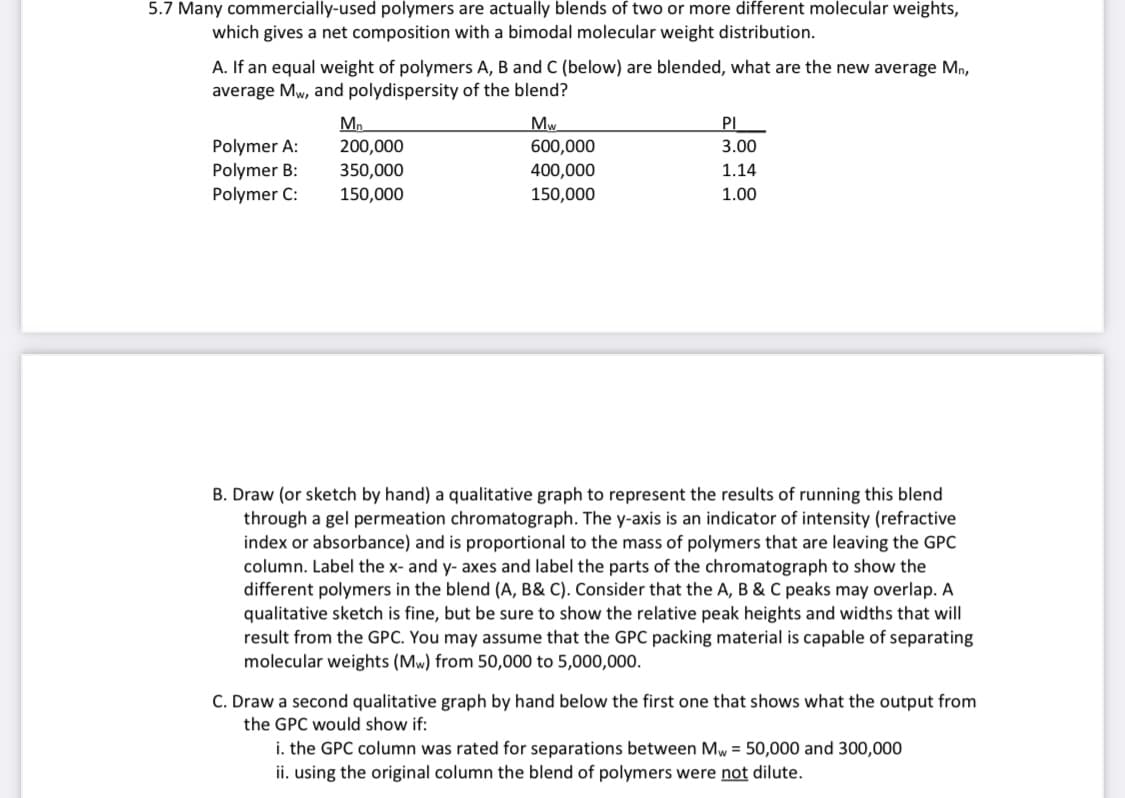
5.7 Many commercially-used polymers are actually blends of two or more different molecular weights, which gives a net composition with a bimodal molecular weight distribution. A. If an equal weight of polymers A, B and C (below) are blended, what are the new average Mn, average Mw, and polydispersity of the blend? Polymer A: Polymer B: Polymer C: Mn 200,000 350,000 150,000 Mw 600,000 400,000 150,000 PI 3.00 1.14 1.00 B. Draw (or sketch by hand) a qualitative graph to represent the results of running this blend through a gel permeation chromatograph. The y-axis is an indicator of intensity (refractive index or absorbance) and is proportional to the mass of polymers that are leaving the GPC column. Label the x- and y- axes and label the parts of the chromatograph to show the different polymers in the blend (A, B& C). Consider that the A, B & C peaks may overlap. A qualitative sketch is fine, but be sure to show the relative peak heights and widths that will result from the GPC. You may assume that the GPC packing material is capable of separating molecular weights (Mw) from 50,000 to 5,000,000. C. Draw a second qualitative graph by hand below the first one that shows what the output from the GPC would show if: i. the GPC column was rated for separations between Mw = 50,000 and 300,000 ii. using the original column the blend of polymers were not dilute.
5.7 Many commercially-used polymers are actually blends of two or more different molecular weights, which gives a net composition with a bimodal molecular weight distribution. A. If an equal weight of polymers A, B and C (below) are blended, what are the new average Mn, average Mw, and polydispersity of the blend? Polymer A: Polymer B: Polymer C: Mn 200,000 350,000 150,000 Mw 600,000 400,000 150,000 PI 3.00 1.14 1.00 B. Draw (or sketch by hand) a qualitative graph to represent the results of running this blend through a gel permeation chromatograph. The y-axis is an indicator of intensity (refractive index or absorbance) and is proportional to the mass of polymers that are leaving the GPC column. Label the x- and y- axes and label the parts of the chromatograph to show the different polymers in the blend (A, B& C). Consider that the A, B & C peaks may overlap. A qualitative sketch is fine, but be sure to show the relative peak heights and widths that will result from the GPC. You may assume that the GPC packing material is capable of separating molecular weights (Mw) from 50,000 to 5,000,000. C. Draw a second qualitative graph by hand below the first one that shows what the output from the GPC would show if: i. the GPC column was rated for separations between Mw = 50,000 and 300,000 ii. using the original column the blend of polymers were not dilute.

Chemistry for Engineering Students
3rd Edition
ISBN:9781285199023
Author:Lawrence S. Brown, Tom Holme
Publisher:Lawrence S. Brown, Tom Holme
Chapter1: Introduction To Chemistry
Section: Chapter Questions
Problem 1.77PAE

Related questions
Question
Transcribed Image Text:5.7 Many commercially-used polymers are actually blends of two or more different molecular weights,
which gives a net composition with a bimodal molecular weight distribution.
A. If an equal weight of polymers A, B and C (below) are blended, what are the new average Mn,
average Mw, and polydispersity of the blend?
Polymer A:
Polymer B:
Polymer C:
M₂
200,000
350,000
150,000
Mw
600,000
400,000
150,000
PI
3.00
1.14
1.00
B. Draw (or sketch by hand) a qualitative graph to represent the results of running this blend
through a gel permeation chromatograph. The y-axis is an indicator of intensity (refractive
index or absorbance) and is proportional to the mass of polymers that are leaving the GPC
column. Label the x- and y- axes and label the parts of the chromatograph to show the
different polymers in the blend (A, B& C). Consider that the A, B & C peaks may overlap. A
qualitative sketch is fine, but be sure to show the relative peak heights and widths that will
result from the GPC. You may assume that the GPC packing material is capable of separating
molecular weights (Mw) from 50,000 to 5,000,000.
C. Draw a second qualitative graph by hand below the first one that shows what the output from
the GPC would show if:
i. the GPC column was rated for separations between Mw = 50,000 and 300,000
ii. using the original column the blend of polymers were not dilute.
Expert Solution
This question has been solved!
Explore an expertly crafted, step-by-step solution for a thorough understanding of key concepts.

This is a popular solution!

Trending now
This is a popular solution!

Step by step
Solved in 2 steps

Knowledge Booster


Learn more about
Need a deep-dive on the concept behind this application? Look no further. Learn more about this topic, chemistry and related others by exploring similar questions and additional content below.Recommended textbooks for you
Chemistry for Engineering Students
Chemistry
ISBN:
9781285199023
Author:
Lawrence S. Brown, Tom Holme
Publisher:
Cengage Learning
Chemistry for Engineering Students
Chemistry
ISBN:
9781285199023
Author:
Lawrence S. Brown, Tom Holme
Publisher:
Cengage Learning