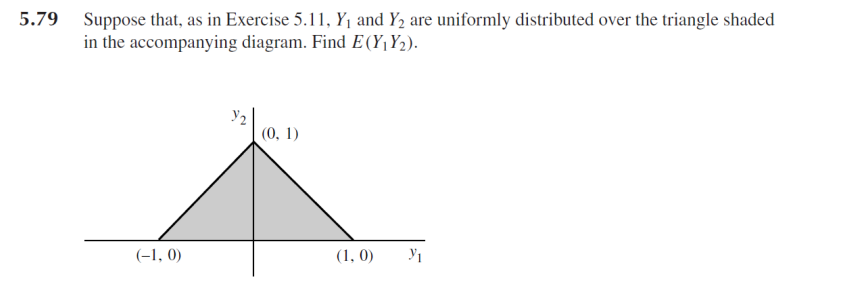
5.79 Suppose that, as in Exercise 5.11, Y¡ and Y2 are uniformly distributed over the triangle shaded in the accompanying diagram. Find E(Y¡Y2). (0, 1) (-1, 0) (1, 0)
Q: A teacher tracked how many minutes each student in his class spent on the unit project and created a…
A: A histogram is given and find the number of students
Q: The National Longitudinal Study of Adolescent Health interviewed several thousand teens (grades 7 to…
A: Hey there! Thank you for posting the question. Since your question has more than 3 parts, we are…
Q: complete the table below, show your complete solution. The data in the table was gathered from a…
A:
Q: Globally, 35% of all ridged brittleshell tortoises have spots on their shells. A herpetologist in…
A: According to guidelines we solve first question only when given questions are different.
Q: elsewhere . If Z = X + 2Y, then what is the joint density of X and Z where nonzero?
A:
Q: 15. In a test of hypothesis about a mean, the critical value for = 0.05 in a two-tailed test is…
A:
Q: these results. Productivity (x) 23 Dexterity (v) 25 28 21 53 59 26 30 34 36 67 75 21 25 49 42 47 53…
A: We have given that, X:- 23, 25, 28, 21, 21, 25, 26, 30, 34, 36 Y:- 49, 53, 59, 42, 47, 53, 55, 63,…
Q: If n = 420 and ˆpp^ (p-hat) = 0.05, construct a 95% confidence interval. Round three places.
A:
Q: Given the supplied information, interpret the results. Be sure to (1) tell what was done, (2)…
A: Give that, A statistics professor has compared the systolic blood pressure of her class (N = 24) (M…
Q: Last year, the weekly salary of a worker is approximately a normal distribution with mean $100 and…
A:
Q: A sample of eligible voters was selected to test if more than 60% of votes intend to vote in the…
A: The following information has been provided: Null and Alternative Hypothesis : Null Hypothesis : 60%…
Q: A research team is working on a project to study the time (in seconds) for high school male runners…
A: The random variable running time follows normal distribution. We have to construct 95% confidence…
Q: Using the standard normal distribution table, the critical value zα/2 needed to construct a 99%…
A:
Q: x-2 If x-N(2,4), then 2 (1) 2.
A: Given that : μ = 2 ? 2 = 4 X ~N ( 2 , 4 ) By using normal distribution property we solve this…
Q: confidence interval for the standard deviation of the true variability for the time taken to…
A: HERE GIVEN, Seven pilots were tested in a flight simulator, and the time taken (in seconds) for each…
Q: Pennsylvanla Refining Company is studying the relationship between the pump price of gasoline and…
A:
Q: 1. A car dealer claims that the average price of Honda Vios is at least 662,000.00. A client…
A: Disclaimer : Since you have asked multiple question, we will solve the first question for you. If…
Q: 5. Can we conclude the slope is not equal to zero? O Yes O No c. Determine the coefficient of…
A: Hello! As you have posted more than 3 sub parts, we are answering the first 3 sub-parts. In case…
Q: You intend to conduct a test of homogeneity for a contingency table with 5 categories in the column…
A:
Q: What is the critical value for the rejection region if the researcher wants to conduct a…
A: It is given that Level of significance = 10% Sample size n = 6 Test : left-tailed
Q: OB. 0.196 OC. 0.256 O D. 0
A: Given We can use Excel function CORREL command in Excel for correlation coefficient
Q: Theorem: FoY n attributes A, Ag,3 ...,An Then show That CA,,Aa, A3,. . An) I CA,tAg+ +CAn)- Cn-1N.
A:
Q: Congress is comprised of the House of Representatives and the Senate. Suppose that 21% are female…
A:
Q: If X*N(0,1) then X2-
A:
Q: Question 3 Prospect Z = ($4 0.25 ; $12,0.50 ; $23,0.25) If Anna's utility of wealth function is…
A:
Q: Find the M.L.E for the population mean in poission distribution and also find variance......
A: We have given the following statement about Poisson distribution.
Q: Quan asked some of his teachers to estimate how much of their own money they spent on classroom…
A: For the given data Select the correct choice
Q: Express the confidence interval (346.3, 655.9) in the form of ± ME.
A: here given , confidence Interval (346.3 , 655.9 ) upper limit = 655.9 lower limit = 346.3
Q: The graph shows the number of errors made over time by a pianist practicing a new piece. 60 50 40 30…
A: Given problem Given that The graph shows the number of errors made over time by a pianist…
Q: Identify the following probability distributions as discrete or continuous. Justify your answer. 20…
A: We have given the following statement about the Poisson distribution, and Geometric distribution.
Q: A statistics instructor claims that the mean score for all students on the first statistics exam is…
A:
Q: Question 3: A game of zumpie consists of 3 teams; 2 teams lose and 1 team wins. Fifty-one teams…
A: Given, Zumpie contain 3 teams : 2team loose and 1 team win Total teams: 51 In each round games are…
Q: it is unbaised estimated of a Then Show That ta is baised estimated of 02. Theorem:- if
A:
Q: IELTS score in móčk exan <4 5 2 5 15 8. 10 3 ented by this tutorial school 5 years ago indicated…
A: *Answer:
Q: People in a city are going to vote for one of the three candidates A, B, and C in the next election.…
A: Candidates : A, B, C Total voters : 100 A:35 B:28 C:37 We have to tell, it is significant or not.
Q: 2.890 A consumer buying cooperative tested the effective heating area of 20 different electric space…
A: The independent variable is Wattage. The dependent variable is Area. We have to do correlation and…
Q: Consider the data with analysis shown in the following computer output: Level N Mean StDev A…
A: For the given data Find The pooled standard deviation is = ?degrees of freedom = ?
Q: 1. A researcher uses a one-sample t-test to test a sample mean based on 27 scores against a…
A: As per our guidelines we can solve first multiple choice question and rest can be reposted.…
Q: The jump heights of 32 students are displayed i the box plot Vertical Jump Heights 30 40 50 60 70 80…
A: A. What percent of students have a vertical jump height of at least 40 cm? B .How many students is…
Q: Express the confidence interval (11.8 % , 18.6 % ) in the form of p + ME. %
A:
Q: Why might the graph be considered misleading? The labels on the y-axis are not presented in order.…
A: Here Given the graph of Number of errors on the different days made by Pianist
Q: 1.- The following data are the top 40 men's finish times (rounded to nearest minute) in the 2022 LA…
A: The given data is related to top 40 men's finish times in the 2022 LA marathon Total no.of men's…
Q: 4. Which of the following better approximates the standard deviation of the sample means? b. 4. N-n…
A: The standard deviation of the sample mean is better described by
Q: Conduct a hypothesis test to determine if preference for paying a subscription fee to utilize the…
A:
Q: A randomly selected sample of n = 60 individuals over 65 years old takes a test of memorization…
A:
Q: Jump to level 1 A software company is interested in improving customer satisfaction rate from the…
A:
Q: A golf pro claims that his mean golf score is 63. A sportswriter wants to test the claim that his…
A: A golf pro claims that his mean golf score is 63. A sportswriter wants to test the claim that his…
Q: The following table shows the frequency distribution of age of all 50 employees in company Number of…
A: Solution-: Let, Class Interval =Number of credit cards and fi=Number of adults We have following…
Q: A sociologist is interested in the difference in voting rates between women and men. One hundred…
A: There are two independent samples which are men and women. We have to construct 95% confidence…
Q: 1. If X,X2.X, forms a random sample of size n from a population with pdf x-0 f(x; 0,8) = 0 o for x>0…
A:
Trending now
This is a popular solution!
Step by step
Solved in 2 steps with 4 images
- Let X1, . . . , Xn i.i.d. U([θ1, θ2]), i.e., X1, . . . , Xn are independent and follow a uniform distribution on the interval [θ1, θ2] for θ1, θ2 ∈ R and θ1 < θ2. Find an estimator for θ1 and θ2 using the method of moments.Let X1, . . . , Xn, . . . ∼ iid Bern(θ). Consider the Bayes estimator under squared error loss with the Unif(0,1) prior. Show that this estimator is consistent.Let {Xi} from i to n be IID from Bernoulli(p). Find the MQ estimator of p.
- Let X1,X2,... be a sequence of identically distributed random variables with E|X1|<∞ and let Yn = n−1max1≤i≤n|Xi|. Show that limnE(Yn) = 0they take samples of 4 fireworks for quality co from and examine them for defects. let X be the number of defective fireworks in the sample of 4.Suppose N = 10 and r = 3. Compute the hypergeometric probabilities for the following values of n and x. n = 4, x = 1. n = 2, x = 2 n = 2, x = 0.
- Let X1, . . . , Xn ∼ iid Unif(θ1, θ2), where both θ1 and θ2 are unknown. Find the MOM estimator and compare them to the MLE.An individual who has automobile insurance from a certain company is randomly selected. Let Y be the number of moving violations for which the individual was cited during the last 3 years. The pmf of Y is the following. Find the following. (a) E[Y ] (b) V[Y]Recall that the assumption MLR.6 states u ∼ N(0, σ2 I), i.e. the error term is normally distributed. (a) Why do we make this assumption? That is, what does this assumption allow us to do? (b) What does the Central Limit Theorem tell us? How does this help us deal with violations of this assumption?
- Let X be a symmetrically distributed RV with mean =0 It is known that P(X^2<1)=a, where a∈(0,1)a∈(0,1) is an unspecified real number. Find P(X<1) in terms of a?If X1, X2, ... , Xn constitute a random sample of size nfrom a geometric population, show that Y = X1 + X2 +···+ Xn is a sufficient estimator of the parameter θ.Let pX(x) be the pmf of a random variable X. Find the cdf F(x) of X and sketch its graph along with that of pX(x) if pX(x)=1/3,x=−1,0,1, zero elsewhere