Jump to level 1 
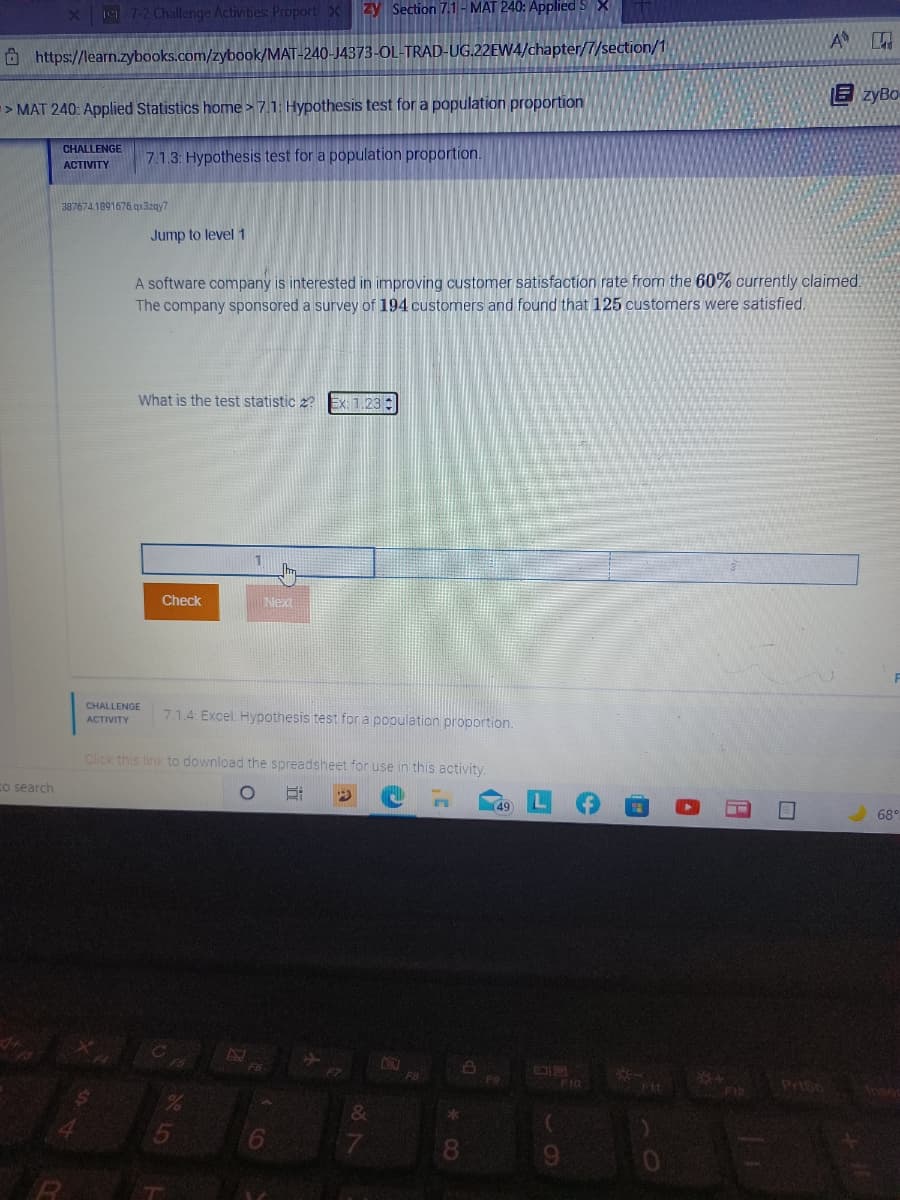
A software company is interested in improving customer satisfaction rate from the 60% currently claimed. The company sponsored a survey of 194 customers and found that 125 customers were satisfied. What is the test statistic 2? Ex: 1.23
Q: x-2 If x-N(2, 4), then ..... ..... G ,2 (1) Option 2 Option 3 N(0,1) Option 1
A: Given that, x~N(2, 4) And We have to find the distribution of x-2/2~... ... ...
Q: What distribution is used to create a confidence interval for a population variance or standard…
A: We given that the statement about the confidence interval for a population variance or standard…
Q: A climatologist is interested in comparing the frequency of cloud cover in Thunder Bay and Sudbury.…
A: Given that A climatologist is interested in comparing the frequency of cloud cover in Thunder Bay…
Q: ) Give a point estimate of the population mean running time for a 400-meter race. ) Calculate the…
A: It is given that Sample size n = 25 Sample mean M = 53 Population SD = 5.5 The critical value of Z…
Q: What is the Central Limit Probability where x is less than 189.73 for a population mean of 180, and…
A: Given that : μ = 180 ? = 61.2 n = 56 By using central limit theorem we find P( x < 189.73 ) = ??
Q: In an examination paper, there are 7 questions in part A out of which any 4 are Example 48. to be…
A:
Q: Question 8 What is the Normal Distribution Probability where X is less than 35.97 for a mean of 43,…
A:
Q: Make an illustration of how you understand the key concept of sampling. Hint: part of a whole
A: The sаmрling frаme is the асtuаl list оf individuаls thаt the sаmрle will be drаwn…
Q: e are two sources of uncertainty: (i) der. Fill in the following table to illu the following table,…
A: A currency forward is a binding contract and the parties involved have to fulfill their part of the…
Q: 1.25 The following data set is related to that in Exer- cise 1.24. It gives the percent of the…
A:
Q: Describe the properties of range, mean deviation, and standard deviation.
A: Properties of range:- 1.) The value of range is always non-negative. (either positive or equal to…
Q: 1) Sample from 3 types of wheat were tested for protein percentage. The data is given below Туре I…
A: There are 3 independent samples which are 3 types of wheat. We have to test whether the protein…
Q: 4. Determine whether the following statements are true or false. No explanation is required. a) A…
A: Since you posted a question with multiple subparts, we will solve first three subparts for you. To…
Q: What is the mean difference between the samples?
A: Test is that whether the mean number of mass transit trips is equal for both neighborhoods. Note :…
Q: following data set indicates number of new cars sold in the last week by a sample dealerships: 8 5…
A: Frequency Distribution A frequency distribution is a visual or tabulated presentation of the…
Q: A political candidate has asked you to conduct a poll to determine what percentage of people support…
A:
Q: Starship Media Entertainment's budget director, Ms. Janice Hammington, wanted to compare the daily…
A:
Q: The following data represent the number of days absent per year in a population of six employees of…
A: We have given data are 1,3,5,6,7,10 Mean for the given data is µ = ∑x/n = (1+3+5+6+7+10)/6 = 5.33
Q: A kindergarten class has four left-handed children and twelve right-handed children. Two children…
A: Given: Let X = the number who are left-handed. Class has four left-handed children and twelve…
Q: Each group should select a dataset, Auto, College or Carseats, and run at least four models, noting…
A: College student's score are considered in the data set for 5 students with 4 variables Science…
Q: Group Statistics Std. Error Mean Std. Мean Neighbourhood Trips A Deviation N 7 22.29 7 43.29 16.760…
A: NOTE: As per the guidelines, we are supposed to solve the first question only. Please repost other…
Q: Find the sample proportion planning to vote for Candidate Y. (Round your answer to two decimal…
A: Given that : Sample size (n) = 400 X = 200 Proportion = x / n By using proportion test we solve…
Q: In a random sample of n = 300 adults, 171 individuals say that they believe in love at first sight.…
A: Given that; Sample size (n) = 300 X = 171 Proportion = x/n By using proportion test formula and…
Q: Problem 2 A class contains seven boys and eight girls. (a) If two are selected at random to leave…
A:
Q: 7) Calculate the vari ence and the standard deviation for the following data 3. 4 Number of children…
A: Given that : A frequency table is here By using this information we calc5 relative frequency and…
Q: 11. 11. In a part of an oil refinery, oil flows through three meters A, B and C which give readings…
A:
Q: Compare the following two sample data sets: A: 5,4,6,3,6,7A: 5,4,6,3,6,7 B: 6,5,7,6,1,8B:…
A: Given that Data : A : 5,4,6,3,6,7 Number of data values (n) = 6 Maximum value = 7 ; Minimum value…
Q: Find the regression equation, letting the first variable be the predictor (x) variable. Using the…
A:
Q: A math teacher claims that she has developed a review course that increases the scores of students…
A:
Q: Question 14 What is the Binomial Probability when the number of trials is 12, probability is 0.78,…
A: Given that We have to find What is the Binomial Probability when the number of trials is 12,…
Q: isted below are amounts of court income and salaries paid to the town justices. All amounts are in…
A: X-court income Y-justice salary A) construct the scatter plot Option c is correct
Q: he following grou Maths test.
A: Hi! Thank you for the question, As per the honor code, we are allowed to answer three sub-parts at a…
Q: Question 15 The claim is a mean is 212 and you want to prove it is more. Test the hypothesis within…
A: Given that Sample size n =59 Sample mean =214.12 Standard deviation =63.6
Q: If n = 420 and ˆpp^ (p-hat) = 0.05, construct a 95% confidence interval. Round three places.
A:
Q: If x-Exp(5), then M,(t) is O 1 susll
A: We have given that x ~ Exp(5) Where, λ = 5 (since x ~ Exp(λ) ) We have to find Mx(t)
Q: A sample is selected from a population with u = 50. After a treatment is administered to the 16…
A: It is given that Sample size n = 16 Sample mean M = 55 Sample Sd s = 8 Population mean = 50
Q: plot back-to-back with the previous stemplot. For #5, make your boxplots side-by- side. PART II:…
A: Hi! Thank you for the question, As per the honour code, we are allowed to answer three sub-parts at…
Q: Suppose that you are interested in estimating the average number of miles per gallon of gasoline…
A: Let X be the random variable from bell-shaped (Normal distribution) with mean (µ) = 24, standard…
Q: Q.7.1 Calculate the following, using the appropriate formulae: (Note: ALL calculations must be…
A: Disclaimer : “Since you have posted a question with multiple sub-parts, we will solve first three…
Q: Illu. 15: On 31st December, 1999, Aditya Traders Ltd., showed in their account the following…
A:
Q: The lengths of text messages are normally distributed with a population standard deviation of 3…
A:
Q: accept a flyer as they pass by follows a Poisson distribution with the rate of u = 4 people per…
A: Since you have posted a question with multiple sub-parts, as per our guidelines, we have provided…
Q: If x-y? (5), then p(0.554 < x < 15.09) (using x? table) 0.980 0.950 0.05
A: We have given that, X ~ χ2(5) Then, We will find fine probability P(0.554 <X<15.09) = ?
Q: (d) Use the combined data of 80 students, construct a 95% confidence interval estimate of the…
A: Given that Total students=n=40+40=80 Number of pass students=X=28+32=60
Q: Find the regression equation, letting the first variable be the predictor (x) variable. Using the…
A: Given,
Q: Briefly explain what is meant by the term “descriptive statistics”.
A: We have to describe descriptive statistics here
Q: fd X = x, + N X = Ans
A: We have given that in an annual audit , a private accounting firm tabulates the time required to…
Q: exit poll of 2293 voters in the 2006 Ohio Senatorial election indicated that 44% voted for the…
A:
Q: 5. Let (x1, 82, .., En) be a random sample from the distribution f(x) = Ax^-1; 0 0. Find the moment…
A:
Trending now
This is a popular solution!
Step by step
Solved in 2 steps with 2 images
- PART D,E,F A researcher wants to compare three different exercise programs. For each program, five volunteers follow it for a month and their weight losses are recorded below. Use a 0.01 significance level to test the claim that the three different exercise programs produce the same mean weight loss Program A: 2.5 8.8 7.3 9.8 5.1 Program B: 5.8 4.9 1.1 7.8 1.2 Program C: 4.3 6.2 5.8 8.1 7.9 a. Define the parameter(s) A. mu 1 equals The mean weight loss by the 5 people on program A mu 2 equals The mean weight loss by the 5 people on program B mu 3 equals The mean weight loss by the 5 people on program C B. mu 1 equals The mean weight loss by all people on program A mu 2 equals The mean weight loss by all people on program B mu 3 equals The mean weight loss by all people on program C C. mu equals The mean weight loss for all people D. p 1 equals The mean…Find the moment generating function ME(t) for an exponential random variable with parameter (lambda) = 1. Sketch the graph of ME(t)A study conducted at Ateneo de Naga University revealed that students who attended class 95 to 100% of the time usually received an A in the class. Students who attended class 80 to 90% of the time usually received a C+ to B+ in the class. Students who attended class less than 80% of the time usually received a D or an F or eventually withdrew from the class. In this research in AdNU with 5000 students in which 100 students participated in the survey, what is the parameter of the study? a. 80% b. 80 - 90% c. 100 d. 95 - 100 % e. 5000
- Elephants and hippos We removed humans from thescatterplot in Exercise 31 because our species was anoutlier in life expectancy. The resulting scatterplot showstwo points that now may be of concern. The point in theupper right corner of this scatterplot is for elephants, andthe other point at the far right is for hippos.a) By removing one of these points, we could makethe association appear to be stronger. Which point?Explain.b) Would the slope of the line increase or decrease?c) Should we just keep removing animals to increase thestrength of the model? Explain.d) If we remove elephants from the scatterplot, the slopeof the regression line becomes 11.6 days per year. Doyou think elephants were an influential point? Explain.13) Random variables X and Y have joint pdf fXY={4xy, 0≤x≤1, 0≤y≤1fXY={4xy, 0≤x≤1, 0≤y≤1 Find Correlation and CovarianceA gardener is interested in seeing if sunlight and fertilizer type interact so that the effect of fertilizer type depends on the amount of sunlight that plants receive. The gardener randomly assigns half of the plants to be in sunlight and half the plants to be in shade. The gardener also randomly assigns half of the plants to receive the new fertilizer and half to receive an old fertilizer. After a month, the gardener measures plant height. 1 What hypothesis test would be most appropriate for answering this research question and why? 2 What are the independent and dependent variables (if any)? 3 How many levels do the independent variable(s) have?