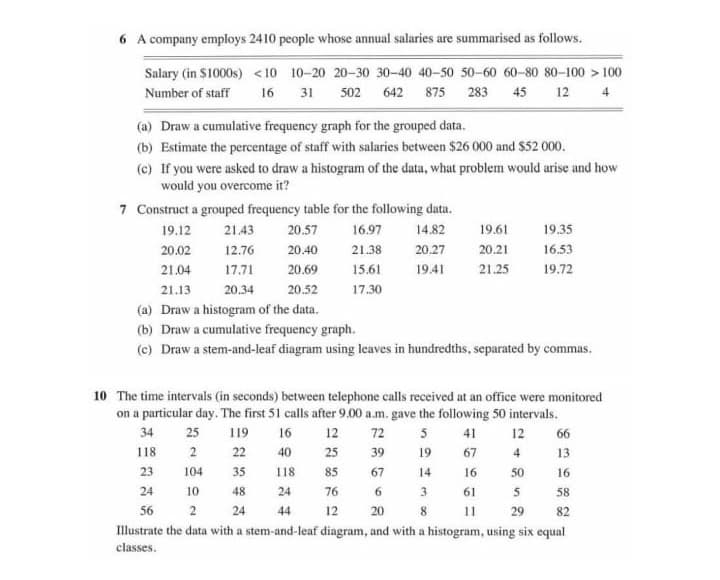
6 A company employs 2410 people whose annual salaries are summarised as follows. Salary (in $1000s) <10 10-20 20-30 30-40 40-50 50-60 60-80 80-100 > 100 Number of staff 16 31 502 642 875 283 45 12 4 (a) Draw a cumulative frequency graph for the grouped data. (b) Estimate the percentage of staff with salaries between $26 000 and $52 000. (c) If you were asked to draw a histogram of the data, what problem would arise and how would you overcome it? 7 Construct a grouped frequency table for the following data. 19.12 21.43 20.57 16.97 14.82 19.61 19.35 20.02 12.76 20.40 21.38 20.27 20.21 16.53 21.04 17.71 20.69 15.61 19.41 21.25 19.72 21.13 20.34 20.52 17.30 (a) Draw a histogram of the data. (b) Draw a cumulative frequency graph. (c) Draw a stem-and-leaf diagram using leaves in hundredths, separated by commas.
6 A company employs 2410 people whose annual salaries are summarised as follows. Salary (in $1000s) <10 10-20 20-30 30-40 40-50 50-60 60-80 80-100 > 100 Number of staff 16 31 502 642 875 283 45 12 4 (a) Draw a cumulative frequency graph for the grouped data. (b) Estimate the percentage of staff with salaries between $26 000 and $52 000. (c) If you were asked to draw a histogram of the data, what problem would arise and how would you overcome it? 7 Construct a grouped frequency table for the following data. 19.12 21.43 20.57 16.97 14.82 19.61 19.35 20.02 12.76 20.40 21.38 20.27 20.21 16.53 21.04 17.71 20.69 15.61 19.41 21.25 19.72 21.13 20.34 20.52 17.30 (a) Draw a histogram of the data. (b) Draw a cumulative frequency graph. (c) Draw a stem-and-leaf diagram using leaves in hundredths, separated by commas.

Functions and Change: A Modeling Approach to College Algebra (MindTap Course List)
6th Edition
ISBN:9781337111348
Author:Bruce Crauder, Benny Evans, Alan Noell
Publisher:Bruce Crauder, Benny Evans, Alan Noell
Chapter5: A Survey Of Other Common Functions
Section5.3: Modeling Data With Power Functions
Problem 6E: Urban Travel Times Population of cities and driving times are related, as shown in the accompanying...

Related questions
Question
Transcribed Image Text:6 A company employs 2410 people whose annual salaries are summarised as follows.
Salary (in S1000s) < 10 10-20 20-30 30-40 40-50 50-60 60-80 80-100 > 100
Number of staff
16
31
502 642 875 283
45
12
4
(a) Draw a cumulative frequency graph for the grouped data.
(b) Estimate the percentage of staff with salaries between $26 000 and $52 000.
(c) If you were asked to draw a histogram of the data, what problem would arise and how
would you overcome it?
7 Construct a grouped frequency table for the following data.
19.12
21.43
20.57
16.97
14.82
19.61
19.35
20.02
12.76
20.40
21.38
20.27
20.21
16.53
21.04
17.71
20.69
15.61
19.41
21.25
19.72
21.13
20.34
20.52
17.30
(a) Draw a histogram of the data.
(b) Draw a cumulative frequency graph.
(c) Draw a stem-and-leaf diagram using leaves in hundredths, separated by commas.
10 The time intervals (in seconds) between telephone calls received at an office were monitored
on a particular day. The first 51 calls after 9.00 a.m. gave the following 50 intervals.
72 5 41 12
34
25
119
16
12
66
118
22
40
25
39
19
67
4
13
23
104
35
118
85
67
14
16
50
16
24
10
48
24
76
6.
3
61
58
56
2
24
44
12
20
8
11
29
82
Illustrate the data with a stem-and-leaf diagram, and with a histogram, using six equal
classes.
Expert Solution
This question has been solved!
Explore an expertly crafted, step-by-step solution for a thorough understanding of key concepts.

This is a popular solution!

Trending now
This is a popular solution!

Step by step
Solved in 2 steps with 1 images

Knowledge Booster


Learn more about
Need a deep-dive on the concept behind this application? Look no further. Learn more about this topic, statistics and related others by exploring similar questions and additional content below.Recommended textbooks for you
Functions and Change: A Modeling Approach to Coll…
Algebra
ISBN:
9781337111348
Author:
Bruce Crauder, Benny Evans, Alan Noell
Publisher:
Cengage Learning

Glencoe Algebra 1, Student Edition, 9780079039897…
Algebra
ISBN:
9780079039897
Author:
Carter
Publisher:
McGraw Hill
Functions and Change: A Modeling Approach to Coll…
Algebra
ISBN:
9781337111348
Author:
Bruce Crauder, Benny Evans, Alan Noell
Publisher:
Cengage Learning
Glencoe Algebra 1, Student Edition, 9780079039897…
Algebra
ISBN:
9780079039897
Author:
Carter
Publisher:
McGraw Hill