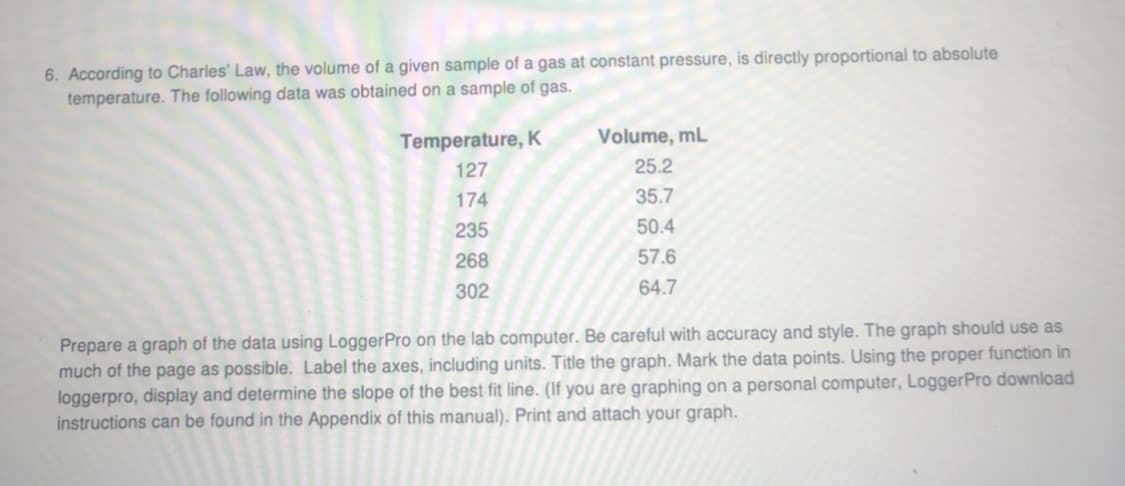
6. According to Charles' Law, the volume of a given sample of a gas at constant pressure, is directly proportional to absolute temperature. The following data was obtained on a sample of gas. Temperature, K Volume, mL 127 25.2 174 35.7 235 50.4 268 57.6 302 64.7 Prepare a graph of the data using LoggerPro on the lab computer. Be careful with accuracy and style. The graph should use as much of the page as possible. Label the axes, including units. Title the graph. Mark the data points. Using the proper function in loggerpro, display and determine the slope of the best fit line. (If you are graphing on a personal computer, LoggerPro download instructions can be found in the Appendix of this manual). Print and attach your graph.
6. According to Charles' Law, the volume of a given sample of a gas at constant pressure, is directly proportional to absolute temperature. The following data was obtained on a sample of gas. Temperature, K Volume, mL 127 25.2 174 35.7 235 50.4 268 57.6 302 64.7 Prepare a graph of the data using LoggerPro on the lab computer. Be careful with accuracy and style. The graph should use as much of the page as possible. Label the axes, including units. Title the graph. Mark the data points. Using the proper function in loggerpro, display and determine the slope of the best fit line. (If you are graphing on a personal computer, LoggerPro download instructions can be found in the Appendix of this manual). Print and attach your graph.

Physical Chemistry
2nd Edition
ISBN:9781133958437
Author:Ball, David W. (david Warren), BAER, Tomas
Publisher:Ball, David W. (david Warren), BAER, Tomas
Chapter1: Gases And The Zeroth Law Of Thermodynamics
Section: Chapter Questions
Problem 1.21E: Pressures of gases in mixtures are referred to as partial pressures and are additive. 1.00 L of He...

Related questions
Question
With a graph please
thank you!
Transcribed Image Text:6. According to Charles' Law, the volume of a given sample of a gas at constant pressure, is directly proportional to absolute
temperature. The following data was obtained on a sample of gas.
Temperature, K
Volume, mL
127
25.2
174
35.7
235
50.4
268
57.6
302
64.7
Prepare a graph of the data using LoggerPro on the lab computer. Be careful with accuracy and style. The graph should use as
much of the page as possible. Label the axes, including units. Title the graph. Mark the data points. Using the proper function in
loggerpro, display and determine the slope of the best fit line. (If you are graphing on a personal computer, LoggerPro download
instructions can be found in the Appendix of this manual). Print and attach your graph.
Expert Solution
This question has been solved!
Explore an expertly crafted, step-by-step solution for a thorough understanding of key concepts.

Step by step
Solved in 2 steps with 1 images

Knowledge Booster


Learn more about
Need a deep-dive on the concept behind this application? Look no further. Learn more about this topic, chemistry and related others by exploring similar questions and additional content below.Recommended textbooks for you
Physical Chemistry
Chemistry
ISBN:
9781133958437
Author:
Ball, David W. (david Warren), BAER, Tomas
Publisher:
Wadsworth Cengage Learning,

General Chemistry - Standalone book (MindTap Cour…
Chemistry
ISBN:
9781305580343
Author:
Steven D. Gammon, Ebbing, Darrell Ebbing, Steven D., Darrell; Gammon, Darrell Ebbing; Steven D. Gammon, Darrell D.; Gammon, Ebbing; Steven D. Gammon; Darrell
Publisher:
Cengage Learning

General, Organic, and Biological Chemistry
Chemistry
ISBN:
9781285853918
Author:
H. Stephen Stoker
Publisher:
Cengage Learning
Physical Chemistry
Chemistry
ISBN:
9781133958437
Author:
Ball, David W. (david Warren), BAER, Tomas
Publisher:
Wadsworth Cengage Learning,
General Chemistry - Standalone book (MindTap Cour…
Chemistry
ISBN:
9781305580343
Author:
Steven D. Gammon, Ebbing, Darrell Ebbing, Steven D., Darrell; Gammon, Darrell Ebbing; Steven D. Gammon, Darrell D.; Gammon, Ebbing; Steven D. Gammon; Darrell
Publisher:
Cengage Learning
General, Organic, and Biological Chemistry
Chemistry
ISBN:
9781285853918
Author:
H. Stephen Stoker
Publisher:
Cengage Learning

Chemistry for Engineering Students
Chemistry
ISBN:
9781337398909
Author:
Lawrence S. Brown, Tom Holme
Publisher:
Cengage Learning

Introductory Chemistry: A Foundation
Chemistry
ISBN:
9781337399425
Author:
Steven S. Zumdahl, Donald J. DeCoste
Publisher:
Cengage Learning

Chemistry by OpenStax (2015-05-04)
Chemistry
ISBN:
9781938168390
Author:
Klaus Theopold, Richard H Langley, Paul Flowers, William R. Robinson, Mark Blaser
Publisher:
OpenStax