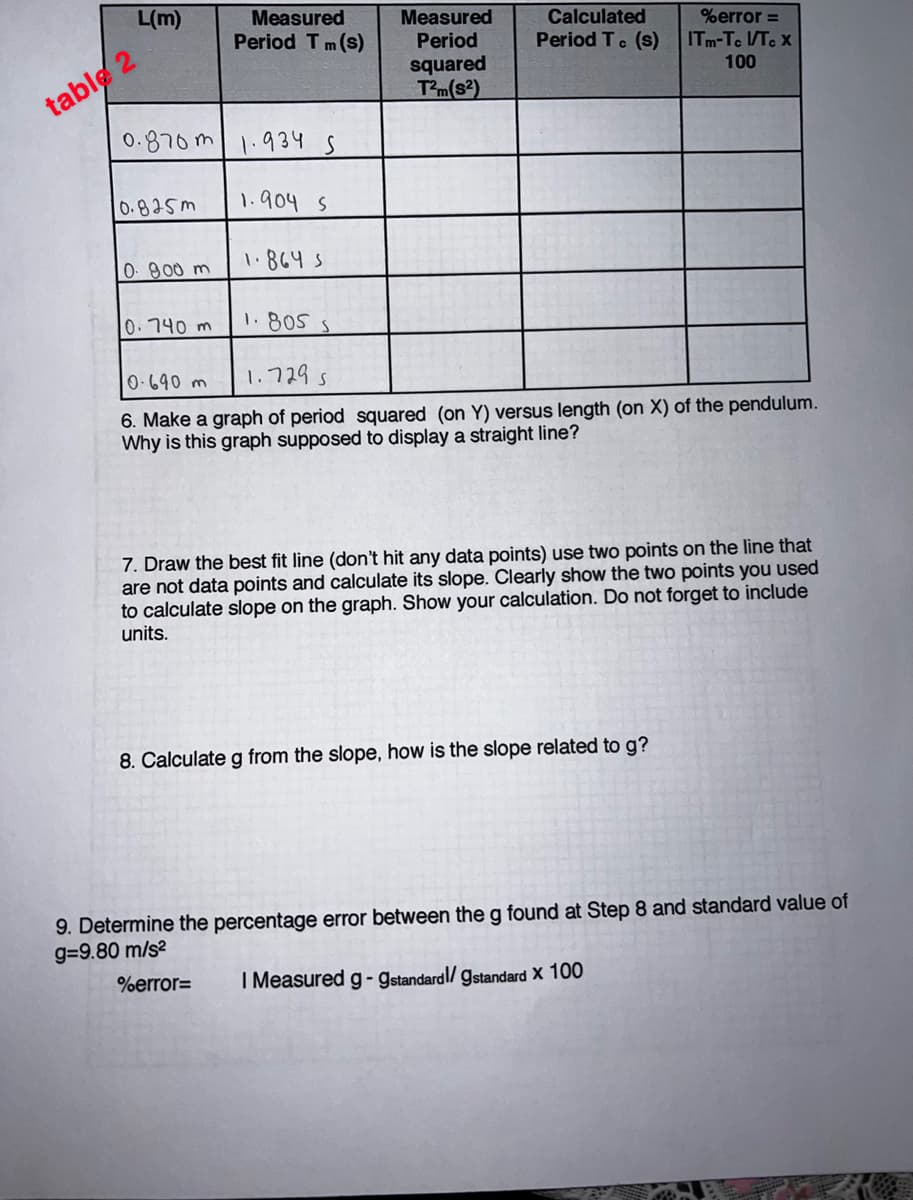
6. Make a graph of period squared (on Y) versus length (on X) of the pendulum. Why is this graph supposed to display a straight line? 7. Draw the best fit line (don't hit any data points) use two points on the line that are not data points and calculate its slope. Clearly show the two points you used to calculate slope on the graph. Show your calculation. Do not forget to include units. 8. Calculate g from the slope, how is the slope related to g? 9. Determine the percentage error between the g found at Step 8 and standard value of g=9.80 m/s² %error= I Measured g-gstandardl/gstandard X 100
Simple harmonic motion
Simple harmonic motion is a type of periodic motion in which an object undergoes oscillatory motion. The restoring force exerted by the object exhibiting SHM is proportional to the displacement from the equilibrium position. The force is directed towards the mean position. We see many examples of SHM around us, common ones are the motion of a pendulum, spring and vibration of strings in musical instruments, and so on.
Simple Pendulum
A simple pendulum comprises a heavy mass (called bob) attached to one end of the weightless and flexible string.
Oscillation
In Physics, oscillation means a repetitive motion that happens in a variation with respect to time. There is usually a central value, where the object would be at rest. Additionally, there are two or more positions between which the repetitive motion takes place. In mathematics, oscillations can also be described as vibrations. The most common examples of oscillation that is seen in daily lives include the alternating current (AC) or the motion of a moving pendulum.
![The period of the pendulum T (in s) is given below, where L-length of pendulum
(in m), g=9.8 m/s².
T= 2TA
g
Laboratory Report
1. Draw a free body diagrams of a pendulum while in motion.
T
RE
0.0500
0.1000
0. 2000
W
Data and Calculations Table 1
Mass (kg)
Rf=
T = tension
W =
weight
Length L= 87 cm = 0.87 m
restoring force
T₁(s)
T₂(s)
T3(S)
Taverage(s)
1.9175 1.9144 s
1.9139 S
1.9153 s
1.9911s
1.92785 1.94945
1.9293
1.9261 1.9376 s 1.9305 1.93145
01.9153-2 x 100
Error
2
= -4.24
= -2.53
2. Calculate the period T for the length that was used Tstandard=1.8711 sec
%error-ITaverage -Tstandard I/Tstandard x 100=
% Error
- 4.24]]
-2.53
-3.43
21.9494-2 x 100
2
3.255% mor
5. Does the period depend on the mass of the pendulum? Explain.
27√
The period is
is a function of 18g only. Tstandard = 2π,
Here there is no dependence of mass with
Tstandard: 2716
the period
1.9314-2x100
2
= -3.43
Taverage: T₁+To+T₂
1.9153+1,9494 +1.9314
3
= 1.9320 sec
Tstandard 1-8711 sec %emr: Tamje - Tstandard.
y na
Tstardard
/ m²: 1.9320-1-87.
1.874
Kor: 3.255 %
voo](/v2/_next/image?url=https%3A%2F%2Fcontent.bartleby.com%2Fqna-images%2Fquestion%2F549651ba-b33d-474d-abf4-48863f7a8bc4%2F5770c6df-82cf-403d-8535-d3228ac7145e%2Fobw7vx9_processed.jpeg&w=3840&q=75)

Step by step
Solved in 5 steps with 4 images


