
MATLAB: An Introduction with Applications
6th Edition
ISBN: 9781119256830
Author: Amos Gilat
Publisher: John Wiley & Sons Inc
expand_more
expand_more
format_list_bulleted
Related questions
Concept explainers
Question
Use the data table to construct a bar graph. Make sure your graph includes a graph title and axis titles. Your x-axis should represent color, and your y-axis should represent the number of students.
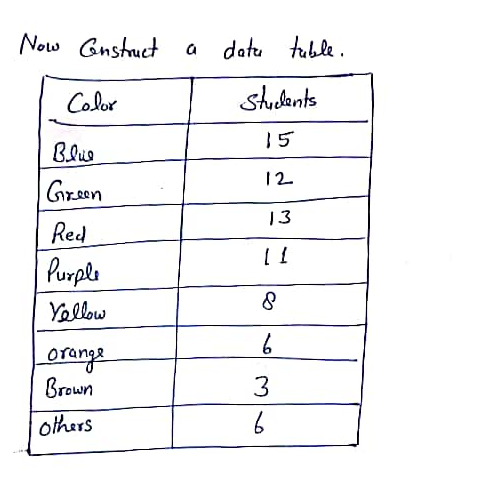

Transcribed Image Text:Now Gnstuct
a datu tuble.
Color
shudents
15
Blue
12
Green
13
Red
Purple
Yellow
orangs
Brown
3
others
Expert Solution
This question has been solved!
Explore an expertly crafted, step-by-step solution for a thorough understanding of key concepts.

This is a popular solution

Trending nowThis is a popular solution!

Step by stepSolved in 2 steps with 2 images

Knowledge Booster


Learn more about
Need a deep-dive on the concept behind this application? Look no further. Learn more about this topic, statistics and related others by exploring similar questions and additional content below.Similar questions
- Mrs. Hoover wanted to know which cookies kindergartners in Spring School District like best. Three hundred students were asked their favorite kind of cookie. The results are displayed in the graph below. About how many kindergartners prefer chocolate chip?arrow_forwardPlease help on this question. Please show all steps.arrow_forwardWhich color are you more likely to pick? Put red cubes and yellow cubes in a bag. Reach in and pick one cube. Color the graph to show what you picked. Put the cube back in the bag. Pick 10 times in all. Write your results. Put 20 red cubes and 10 yellow cubes in a bag. 3 Put 20 red cubes and 2 yellow cubes in a bag. Don't peek! Put 10 red cubes and 10 yellow cubes in a bag. Share Compare your results with your classmates. How are they alike? How are they different? red yellow red yellow red yellow COOarrow_forward
- Graph the line. 1 . リーーX+3 4 y%3Darrow_forwardA nurse recorded the pain level of a sample of patients being treated for the same illness. Pain levels were recorded using one of the following: no pain, minor pain, moderate pain, severe pain. Which type(s) of graph(s) and/or table(s) can be used to display the nurse's results? [Select all that apply (i.e. you may select 1 or more answers)] OA. Bar chart OB. Dotplot OC. Boxplot OD. Histogram OE. Frequency distributionarrow_forwardGraph the inverse of the provided graph on the accompanying set of axes. You must plot at least 5 points. *Click the graph to make a point. Click it again to erase.* 1 2 3 4 56 7arrow_forward
- Governor Political Affiliation and Total State Expenditure per capita: Using a PivotTable: Prepare a cross tabulation of governor political affiliation (rows) and total state expenditure per capita (columns). Group Settings: min= 3970, max=16896, by=3500. No need to copy and paste the table to the homework. But you need it for the next step. Prepare a 100% Stacked Bar Chart of Governor Political Affiliation (horizontal axis category) and Total State Expenditure per capita (stacked categories). Copy and Paste it here. Which political party spends the most? I just need commands to get me to the final result thanks!arrow_forwardGraph the line. y= -3x 8. Explination Checkarrow_forwardTamarr needs to buy shredded wood for his children's playground. The shredded wood costs $5 per ton, and there is a delivery cost of $16 with each order. *Make a table showing ordered pairs with at least three points.arrow_forward
- complete the chart and graph.arrow_forwardHow do you make a stem and leaf graph with numbers such as these 0.06, 0.07,0.09,... 0.35 including a key. Thank youarrow_forwardGilbert earns $7.50 per hour washing cars graph the relationship between the number of hours Gilbert works and the total amount of money he earnsarrow_forward
arrow_back_ios
SEE MORE QUESTIONS
arrow_forward_ios
Recommended textbooks for you
- MATLAB: An Introduction with ApplicationsStatisticsISBN:9781119256830Author:Amos GilatPublisher:John Wiley & Sons Inc
 Probability and Statistics for Engineering and th...StatisticsISBN:9781305251809Author:Jay L. DevorePublisher:Cengage Learning
 Statistics for The Behavioral Sciences (MindTap C...StatisticsISBN:9781305504912Author:Frederick J Gravetter, Larry B. WallnauPublisher:Cengage Learning
  Elementary Statistics: Picturing the World (7th E...StatisticsISBN:9780134683416Author:Ron Larson, Betsy FarberPublisher:PEARSON
 The Basic Practice of StatisticsStatisticsISBN:9781319042578Author:David S. Moore, William I. Notz, Michael A. FlignerPublisher:W. H. Freeman
 Introduction to the Practice of StatisticsStatisticsISBN:9781319013387Author:David S. Moore, George P. McCabe, Bruce A. CraigPublisher:W. H. Freeman
MATLAB: An Introduction with Applications
Statistics
ISBN:9781119256830
Author:Amos Gilat
Publisher:John Wiley & Sons Inc
Probability and Statistics for Engineering and th...
Statistics
ISBN:9781305251809
Author:Jay L. Devore
Publisher:Cengage Learning
Statistics for The Behavioral Sciences (MindTap C...
Statistics
ISBN:9781305504912
Author:Frederick J Gravetter, Larry B. Wallnau
Publisher:Cengage Learning
Elementary Statistics: Picturing the World (7th E...
Statistics
ISBN:9780134683416
Author:Ron Larson, Betsy Farber
Publisher:PEARSON
The Basic Practice of Statistics
Statistics
ISBN:9781319042578
Author:David S. Moore, William I. Notz, Michael A. Fligner
Publisher:W. H. Freeman
Introduction to the Practice of Statistics
Statistics
ISBN:9781319013387
Author:David S. Moore, George P. McCabe, Bruce A. Craig
Publisher:W. H. Freeman