7. Construct one table that includes relative frequencies based on the frequency distributions shown below, then compare the amounts of tar in nonfiltered and filtered cigarettes. Do the cigarette filters appear to be effective? (Hint: The filters reduce the amount of tar ingested by the smoker.) 2 Click the icon to view the frequency distributions. Complete the relative frequency table below. Relative Relative Frequency Tar (mg) (Nonfiltered) Frequency (Filtered) 5-10 11- 16 17-22 23-28 29-34 35- 40 41-46 (Simplify your answers.) Do cigarette filters appear to be effective? O A. Yes, because the relative frequency of the higher tar classes is greater for nonfiltered cigarettes. OB. B. No, because the relative frequency of the higher tar classes is greater for filtered cigarettes. C. No, because the relative frequencies for each are not substantially different. D. This cannot be determined. 2: Frequency Distributions Tar (mg) in Tar (mg) in Nonfiltered Filtered Cigarettes Frequency Cigarettes Frequency 17-22 1 5-10 23-28 11-16 29 - 34 13 17-22 35-40 23-28 14 41-46 of Best Actress when Cumulative
7. Construct one table that includes relative frequencies based on the frequency distributions shown below, then compare the amounts of tar in nonfiltered and filtered cigarettes. Do the cigarette filters appear to be effective? (Hint: The filters reduce the amount of tar ingested by the smoker.) 2 Click the icon to view the frequency distributions. Complete the relative frequency table below. Relative Relative Frequency Tar (mg) (Nonfiltered) Frequency (Filtered) 5-10 11- 16 17-22 23-28 29-34 35- 40 41-46 (Simplify your answers.) Do cigarette filters appear to be effective? O A. Yes, because the relative frequency of the higher tar classes is greater for nonfiltered cigarettes. OB. B. No, because the relative frequency of the higher tar classes is greater for filtered cigarettes. C. No, because the relative frequencies for each are not substantially different. D. This cannot be determined. 2: Frequency Distributions Tar (mg) in Tar (mg) in Nonfiltered Filtered Cigarettes Frequency Cigarettes Frequency 17-22 1 5-10 23-28 11-16 29 - 34 13 17-22 35-40 23-28 14 41-46 of Best Actress when Cumulative

Glencoe Algebra 1, Student Edition, 9780079039897, 0079039898, 2018
18th Edition
ISBN:9780079039897
Author:Carter
Publisher:Carter
Chapter10: Statistics
Section10.6: Summarizing Categorical Data
Problem 23PPS

Related questions
Question
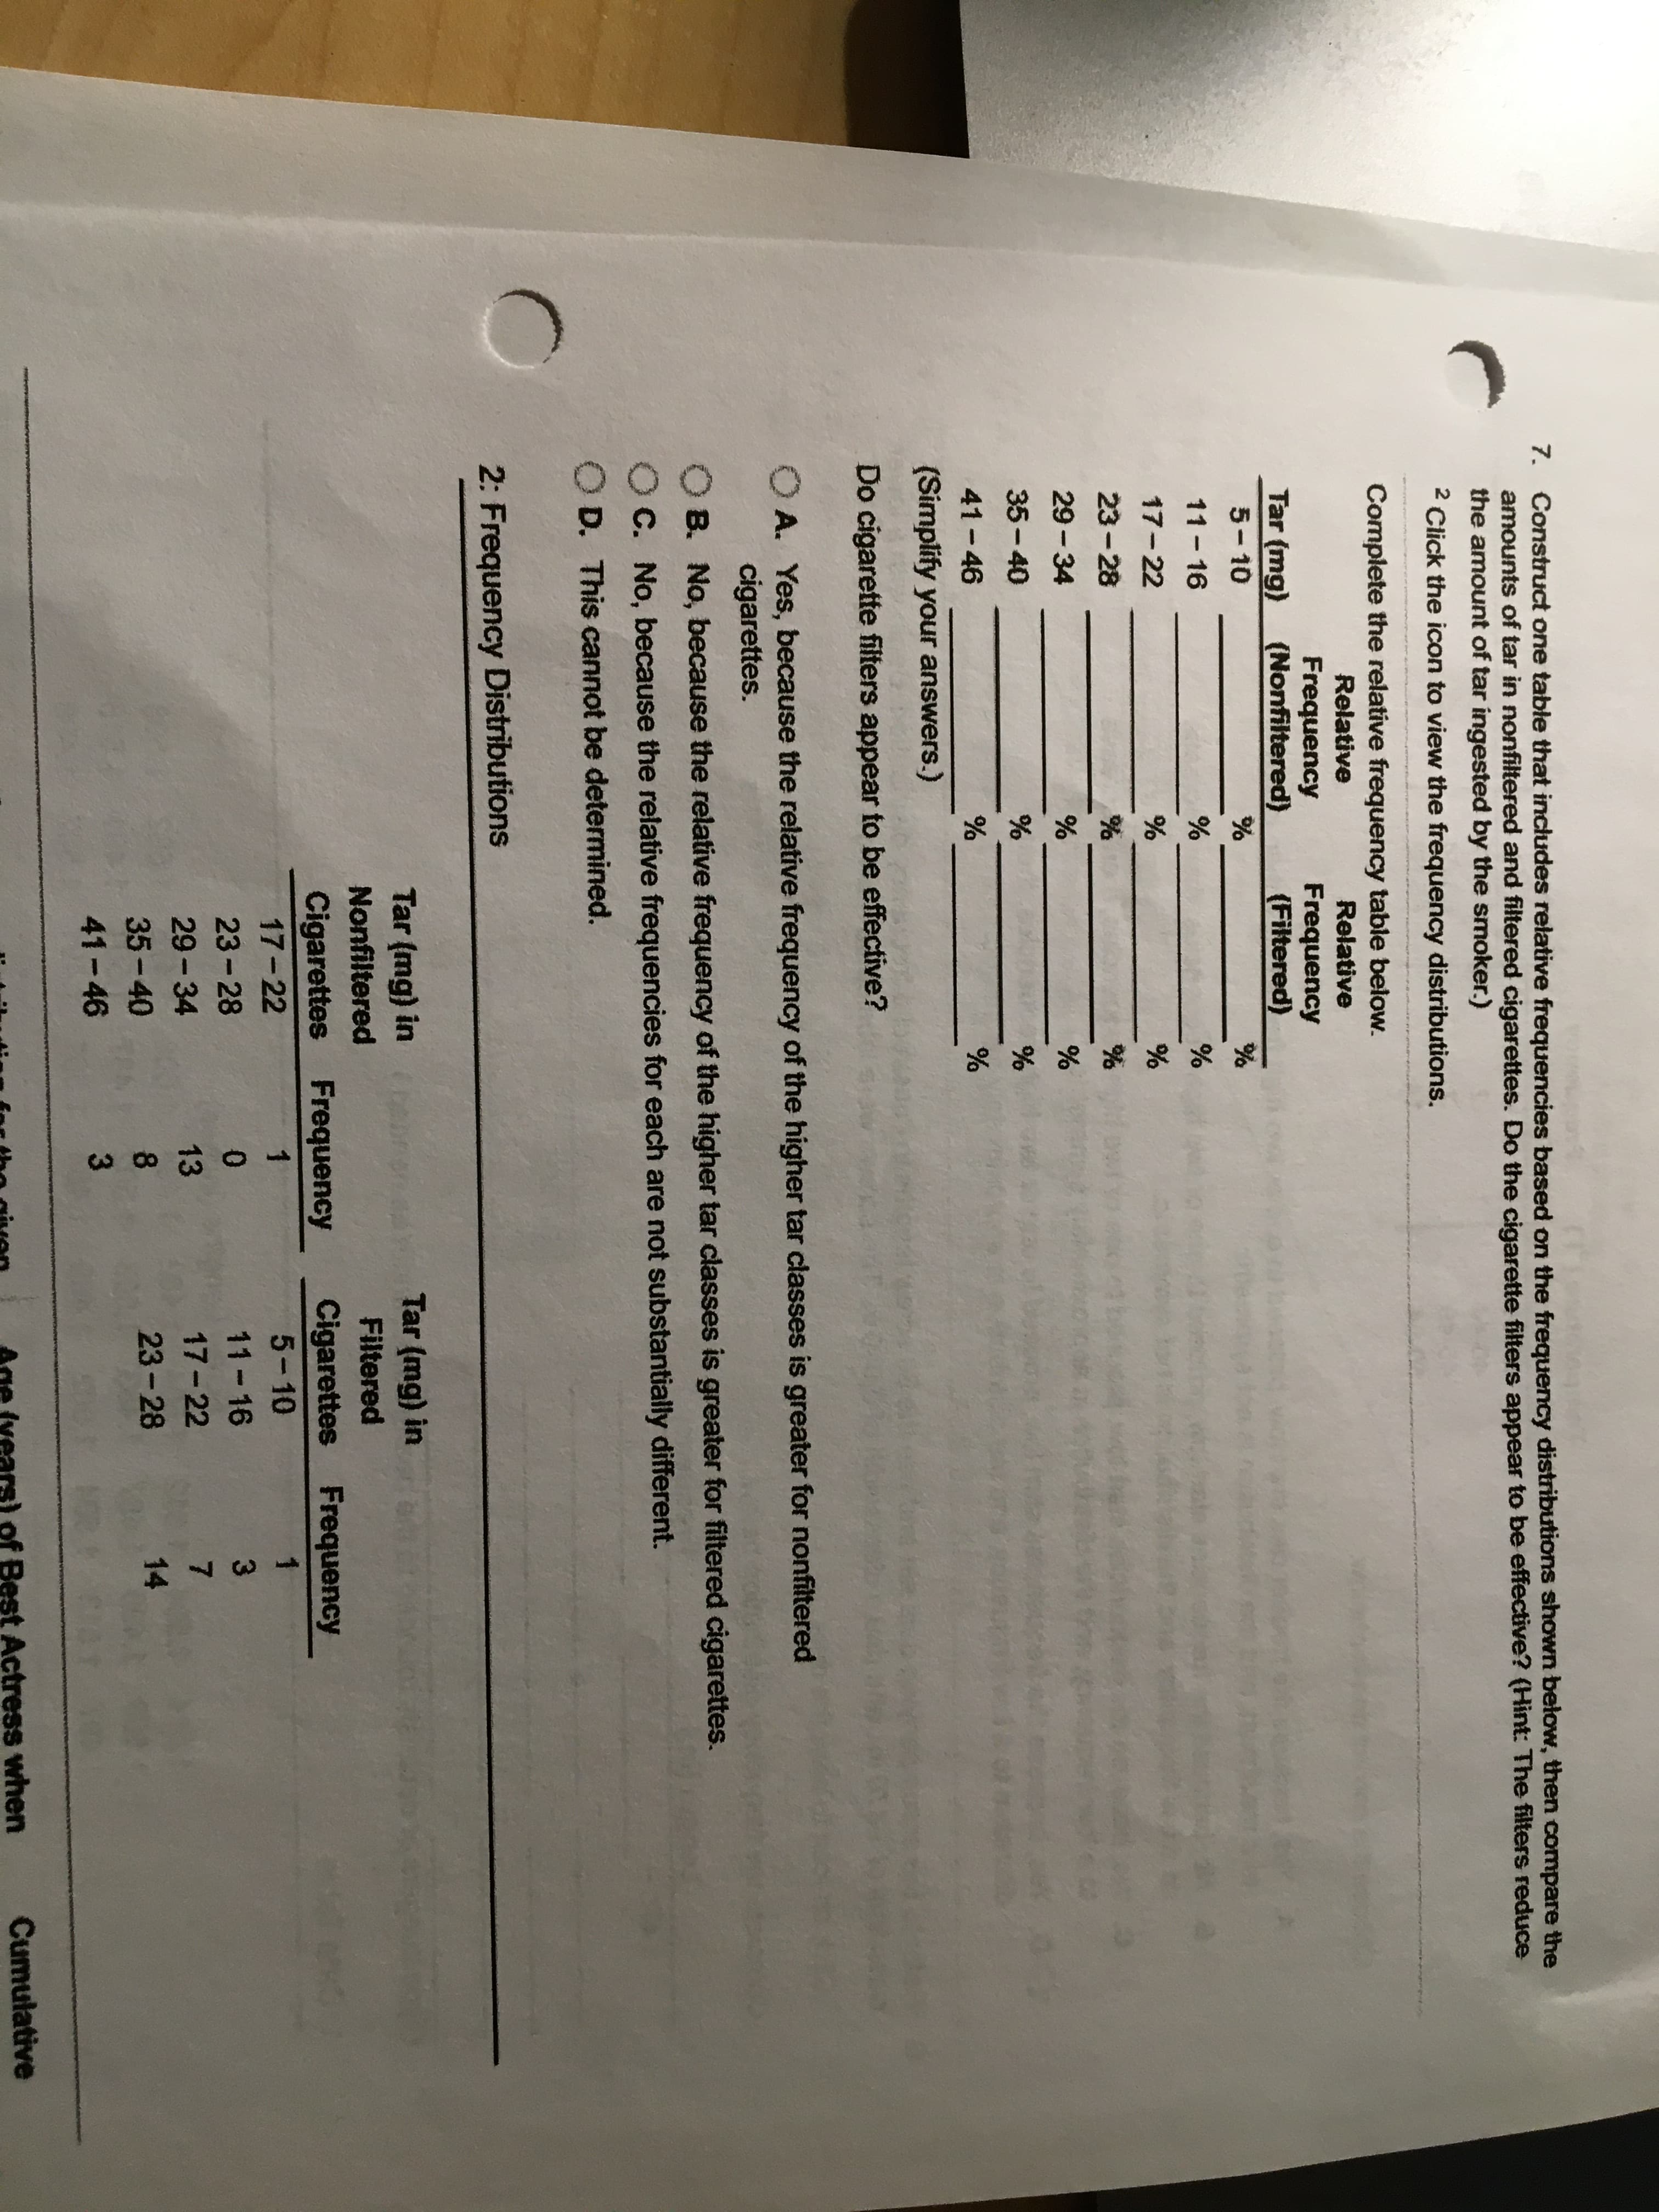
Transcribed Image Text:7. Construct one table that includes relative frequencies based on the frequency distributions shown below, then compare the
amounts of tar in nonfiltered and filtered cigarettes. Do the cigarette filters appear to be effective? (Hint: The filters reduce
the amount of tar ingested by the smoker.)
2 Click the icon to view the frequency distributions.
Complete the relative frequency table below.
Relative
Relative
Frequency
Tar (mg) (Nonfiltered)
Frequency
(Filtered)
5-10
11- 16
17-22
23-28
29-34
35- 40
41-46
(Simplify your answers.)
Do cigarette filters appear to be effective?
O A. Yes, because the relative frequency of the higher tar classes is greater for nonfiltered
cigarettes.
OB.
B. No, because the relative frequency of the higher tar classes is greater for filtered cigarettes.
C. No, because the relative frequencies for each are not substantially different.
D. This cannot be determined.
2: Frequency Distributions
Tar (mg) in
Tar (mg) in
Nonfiltered
Filtered
Cigarettes Frequency
Cigarettes Frequency
17-22
1
5-10
23-28
11-16
29 - 34
13
17-22
35-40
23-28
14
41-46
of Best Actress when
Cumulative
Expert Solution
This question has been solved!
Explore an expertly crafted, step-by-step solution for a thorough understanding of key concepts.

This is a popular solution!

Trending now
This is a popular solution!

Step by step
Solved in 2 steps with 1 images

Recommended textbooks for you
Glencoe Algebra 1, Student Edition, 9780079039897…
Algebra
ISBN:
9780079039897
Author:
Carter
Publisher:
McGraw Hill
Glencoe Algebra 1, Student Edition, 9780079039897…
Algebra
ISBN:
9780079039897
Author:
Carter
Publisher:
McGraw Hill