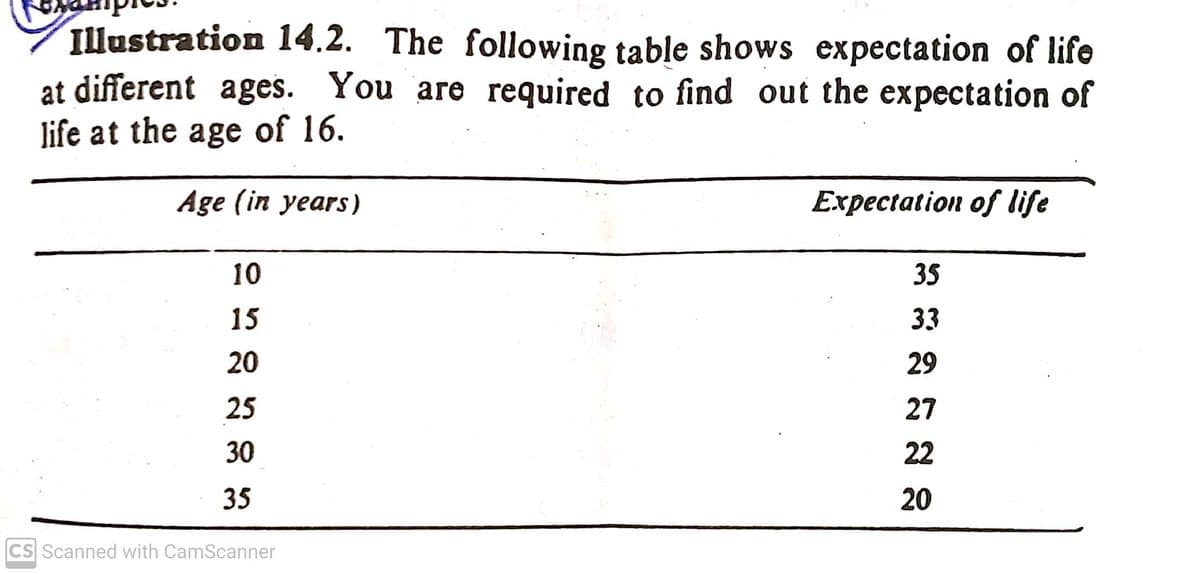
Illustration 14.2. The following table shows expectation of life at different ages. You are required to find out the expectation of life at the age of 16. Age (in years) Expectation of life 10 35 15 33 20 29 25 27 30 22 35 20


Q: A. You are interested in carrying out a statistical test of income in a particular neighborhood.…
A: Since you have asked multiple question, we will solve the first question for you. If you want any…
Q: Percentile 40th percentile 2. 25th percentile 10 9oth percentile 95th percentile 97.5th percentile…
A: here use given percentile for t- value percentile represent the area left of particular value
Q: The mean score and standard deviation of the test scores of students in Section 208 of a statistics…
A: For section 208 Population mean μ1=25.4, standard deviations σ1=4.85 For section 209 Population…
Q: Though 70% of women with children younger than 18 years participate in the labor force, society…
A: We have given that, Sample proportion (p̂) = 18% = 0.18 and sample size (n) = 435 Then, We will…
Q: Suppose coordinate frames S and S' are in the standard configuration and S' is moving at a speed V =…
A:
Q: 10 Some fruit are sold whose weights follow a normal distribution such that X~N(80, 15) If the…
A:
Q: If we turn on the Geiger counter, what is the probability, correct to 3 decimal places, that the…
A:
Q: A college professor suspects that students at his school are getting less than 8 hours of sleep a…
A:
Q: Ilustration 12.4. (Odd number of years.) Taking the originał values the actual sales for the years…
A:
Q: Different brands (n= 20) of vaccines were tested to see how long they would to fight virus. The…
A: For the given data Calculate the 1. Standard deviation2. Variance3. Percentile 60
Q: Use the following scenario to conduct a hypothesis test. You will again go through the different…
A: Given: p = 0.58 x = 364 n = 682 α = 0.05
Q: Why would a researcher choose to conduct an One-Way ANOVA rather than multiple independent samples…
A: Solution-: Why would a researcher choose to conduct an One-Way ANOVA rather than multiple…
Q: The lengths of a professor's classes has a continuous uniform distribution between 50.0 min and 52.0…
A: X follow the uniform distribution i.e. u ( 50.0 , 52.0) By using the uniform distribution we find…
Q: Using z scores, a population with u = 37 and o = 6 is standardized so that the new mean is u = 50…
A:
Q: How much will person pay for 6.2 pounds of bananas at a price of 0.93$ per pounds
A: Given that Number of pounds of bananas = 6.2 pounds Cost per pound of bananas = $0.93 We know…
Q: Given the probability density function f(x) = over the interval (1, 3], find the expected value, the…
A: Given that! f(x) = 1/2 at (1, 3) By using expectation and variance rule we solve this problem.
Q: You are conducting a hypothesis test where the null hypothesis is that mu is less than or equal to…
A:
Q: The amount of fuel used by jumbo jets to take off is normally distributed with a mean of 4,000…
A:
Q: In the last quarter of 2007, a group of 64 mutual funds had a mean return of 3.9% with a standard…
A: Use the Normal Distribution 68:95:99.7 Rule................
Q: The lengths of pregnancies in a small rural village are normally distributed with a mean of 261 days…
A:
Q: Sugar Consumption A researcher is interested in investigating the relationship between sugar…
A: The objective is to determine uses principle in given study the investigator is interested in…
Q: A political scientist claims that 38% of first-year college students characterize themselves as…
A: Hypothesis Ho: p=0.38 vs H1: p≠0.38 X=225, n=500 p^=x/n
Q: A study used 1259 patients who had suffered a stro aspirin treatment or a placebo treatment. During…
A: Out of 634 people received placebo, 25 people died from heart attack. That is, n1= 634 and x1= 25…
Q: A factory produces bars of chocolate that follow a Normal Distribution with a mean weight of 70g and…
A: Given that. X~Normal( μ = 70 , ?2 = 9) μ =70 , ?=3
Q: study of 1,666 US older adults found that 40.4% rate their mental health as very good. What is the…
A: Given that n=1666 , p=40.4%=0.404
Q: Suppose you work for an organization that runs tests for life-threatening diseases and then…
A: Consider scenario 1: Suppose you work for an organization that runs tests for life-threatening…
Q: C. Tell whether the given data is descriptive or inferential statistics. 1. The average age of the…
A: The three scenarios are given. We have to identify whether the given data is descriptive or…
Q: Suppose that the random variable z, shown below, represents the number times. P(z) represents the…
A: From the provided information, x P (x) 0 0.2686 1 0.264 2 0.2633 3…
Q: Nlustration 12.7. Below are given figures of. production in 000 quintals of a Sugar factory. 1945…
A:
Q: CNNBC recently reported that the mean annual cost of auto insurance is 977 dollars. Assume the…
A: Let X be the random variable from normal distribution with mean (μ) = 977 dollars, standard…
Q: 6 A factory produces bars of chocolate that follow a Normal Distribution with a mean weight of 70g…
A: Mean(µ) = 70 Variance (σ2 ) = 9Standard deviations (σ) = √Varince(σ2)=√9 = 3X ~ N (µ, σ )= N(70, 3)
Q: 2. Determine if there is relationship between the age of person in years and their weight in kg…
A: Solution : The following information has been given: Age X Weight Y 11 40 12 42 13 38 14…
Q: Scores frequency 16-20 2 21-25 7 26-30 14 31-35 8 36-40 8 41-45 1 find the standard deviation and…
A: Solution-: We have following table: We find the standard deviation and tell whether or not the…
Q: Two bus lines, Essex Express (EE) and Hudson Heights (HH), operate along the same route. The city's…
A: Hey there! Thank you for posting the question. Since there are multiple questions posted, we will…
Q: Choose the correct type of data and level of measurement for green. I. Discrete II. Qualitative II.…
A: We know that Nominal data: Nominal data measure qualitative data and it is the name of variable.…
Q: Find the critical value zy /2 that corresponds to the given confidence level. 90% ... Za/2 (Round to…
A: We have given that Confidence level (c) = 90% = 0.90
Q: 29 is I. Discrete II. Qualitative II. Quantitative IV. Continuous Choose all the correct…
A: Solution
Q: QUESTION 19 Consider the following context: Two bus lines, Essex Express (EE) and Hudson Heights…
A:
Q: An article in Air and Waste ["Update on Ozone Trends in California's South Coast Air Basin" (Vol.…
A: Data is given for no. Of days and index according to years, We have to find least-squares regression…
Q: Health insurers are beginning to offer telemedicine services online that replace the common office…
A: Given,sample size(n)=20degrees of freedom(df)=n-1df=20-1=19α=1-0.95=0.05α2=0.025t0.025(19)=2.093…
Q: zhe pearsou Carrilalion coyfice determenation Calaulate and corygincient of Interpret and diaw megul…
A: Hello! As you have posted more than 3 sub parts, we are answering the first 3 sub-parts. In case…
Q: Obtain the exponential trend equation and the trend values for the following data. 1994 1995 1996…
A:
Q: alculate the SEM for the following data: a. Population standard deviation = 25 b. Sample size = 36
A:
Q: 10 Some fruit are sold whose weights follow a normal distribution such that X-N(80, 15) If the…
A: (10) Obtain the maximum weight of a small fruit. The maximum weight of a small fruit is obtained…
Q: A laundry detergent company wants to determine if a new formula of detergent, A, cleans better than…
A: Obtain the 90% confidence interval for the difference in proportions of clothes that receive a…
Q: 8 The population of a country follows a normal distribution with mean height 175 cm and standard…
A: Given Population mean μ=175, standard deviations σ=6 Let X be the height X~N(μ=175, σ=6) Note:…
Q: The following question is from Interpreting Basic Statistics by Holcomb 8th edition: - How many…
A: Given Theoretical question
Q: In Exercises 31 and 32, check that the conditions for carrying out a one-sample z test for the…
A: The random variable students typically walk to school follows normal distribution. We have to find…
Q: If we say the results of a hypothesis test are________________________, this means they are unlikely…
A: Statistical significant defines occurrence by chance.
Q: roblem (6) A study used 1259 patients who had suffered a stroke. The study randomly assigned each…
A: Given n1=634 p1= 25/634 = 0.0394 n2= 625 p2=18/625 = 0.0288 Find Part a and b

Step by step
Solved in 3 steps with 3 images

- Table 6 shows the year and the number ofpeople unemployed in a particular city for several years. Determine whether the trend appears linear. If so, and assuming the trend continues, in what year will the number of unemployed reach 5 people?If you were to repeat this study for students in your school district how would you plan the study so that you can learn, as accurately as possible the true interest levels for all of the topics being asked about?If we add a constant (for example, d) to all data values, how will this affect the geometric mean? Find the relationship to this by proof and symbols.
- The following data are the score of 24 students in Midterm Examination. If JM is one of these 24 students and got a score of 80, in what percentile does her score belong?Use information that given as table: Calculation: 1. observed deaths (∑ Obs)=……………? 2. expected deaths = population rates ⅹ person-years: a) expected deaths 1950∼1954? b) expected deaths 1955∼1959? c) expected deaths 1960∼1964? 3. expected deaths (∑ Exp)=……………? 4. SMR ?This is the data for the previous question
- The MAD for the forecast developed using a weighted 2-year moving average with weights of 0.350.35 and 0.650.65 is what?Question 4 Missy Walters owns a mail-order business specializing in baby clothes. She is considering offering her customers a discount on shipping charges based on the dollar amount of the mail order. Before Missy decides the discount policy, she needs a better understanding of the dollar amount distribution of the mail orders she receives. Missy had an assistant randomly select 50 recent orders and record the value, to the nearest dollar, of each order as shown below. 136 281 226 123 178 445 231 389 196 175211 162 212 241 182 290 434 167 246 338194 242 368 258 323 196 183 209 198 212277 348 173 409 264 237 490 222 472 248231 154 166 214 311 141 159 362 189 260 a. Determine the mean, median, and mode for this data set.b. Determine the 80th percentile.c. Determine the first quartile.d. Determine the range and interquartile range.e. Determine the sample variance, sample standard deviation, and coefficient of variation.f. Determine the z-scores for the minimum and maximum values in the…Which of the following is a good prediction of the outside temperature if the number of ice cream cones sold is 70?
- The following data are annual 15-min peak rainfall intensities I (in./hr) for 9 years of record. Compute and plot the log,,-normal frequency curve and the data. Use the Weibull plotting position formula. Using both the curve and the mathematical equation estimate (a) the 25-yr, 15-min peak rainfall intensity; (b) the return period for an intensity of 7 in./hr; (c) the probability that the annual maximum 15-min rainfall intensity will be between 4 and 6 in./hr.If Reina places in the 90th percentile on an exam, then the meaning of this statement is: a. Her examination score was 90%. b. No other scores on the exam are greater than 90%. c. Al other exam scores were less than or equal to 90%. d. 90% of the other examination scores were equal to or lower than her score.Can you please help with this question? Life insurance companies are keenly interested in predicting how long their customers will live, because their premiums and profitability depend on such numbers. An actuary for one insurance company gathered data from 100 recently deceased male customers. He recorded the age at death of the customer plus the ages at death of his mother and father, the mean ages at death of his grandmothers and the mean ages at death of his grandfathers. These data are recorded in columns 1 to 5 respectively, in file LONGEVITY.xlsx. a Perform a multiple regression analysis on these data. b Interpret the coefficient estimates and their signs. c Test for the significance of all the independent variable coefficients. (alpha = 0.05) d Is the model likely to be useful in predicting men’s longevity? e Are the required conditions satisfied? Justify your answer. f Predict the longevity of a man whose parents lived to the age of 70, whose grandmothers averaged 80 years and…

