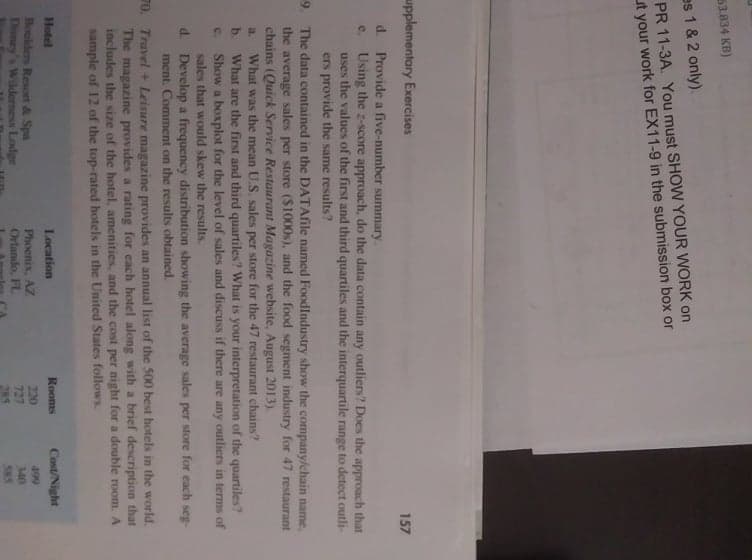
8. In 2007 the New York Times reported that the median annual household income in the United States was $55.500 (New York Times website, August, 21, 2013). Answer the following questions based on the following sample of 14 household incomes for 2013 (S1000s). 48.7 51.3 46.5 52,1 52.9 52.1 51.2 49.4 52.4 53.4 51.6 52.5 52.2 64.5 a. What is the median houschold income for the sample data for 2013? b. Based on the sample data, estimate the percentage change in the median household income from 2007 to 2013. c. Compute the first and third quartiles.
8. In 2007 the New York Times reported that the median annual household income in the United States was $55.500 (New York Times website, August, 21, 2013). Answer the following questions based on the following sample of 14 household incomes for 2013 (S1000s). 48.7 51.3 46.5 52,1 52.9 52.1 51.2 49.4 52.4 53.4 51.6 52.5 52.2 64.5 a. What is the median houschold income for the sample data for 2013? b. Based on the sample data, estimate the percentage change in the median household income from 2007 to 2013. c. Compute the first and third quartiles.

MATLAB: An Introduction with Applications
6th Edition
ISBN:9781119256830
Author:Amos Gilat
Publisher:Amos Gilat
Chapter1: Starting With Matlab
Section: Chapter Questions
Problem 1P

Related questions
Question
#68 please.... cant get anyone on live chat to help AT ALL!!
thank you so much!!!!! :) attached
Transcribed Image Text:469
430
446
422
441
470
354
468
387
445
444
424
402
360
461
407
357
435
464
374
413
351
417
445
387
460
352
468
384
367
368
430
405
436
390
464
372
401
388
367
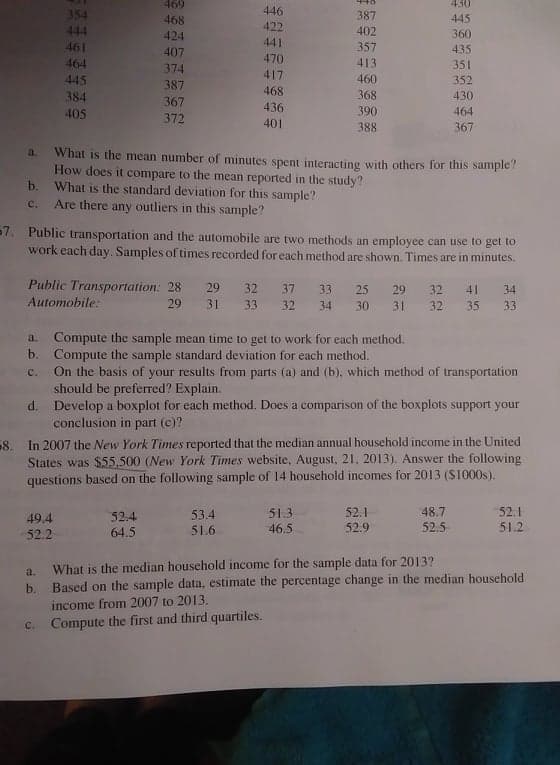
What is the mean number of minutes spent interacting with others for this sample?
How does it compare to the mean reported in the study?
b. What is the standard deviation for this sample?
a.
C.
Are there any outliers in this sample?
57. Public transportation and the automobile are two methods an employee can use to get to
work each day. Samples of times recorded for each method are shown. Times are in minutes.
Public Transportation: 28
29
32
37
33
25
29
32
41
34
Automobile:
29
31
33
32
34
30
31
32
35
33
Compute the sample mean time to get to work for each method.
b. Compute the sample standard deviation for each method.
On the basis of your results from parts (a) and (b), which method of transportation
should be preferred? Explain.
d. Develop a boxplot for each method. Does a comparison of the boxplots support your
conclusion in part (e)?
a.
C.
8. In 2007 the New York Times reported that the median annual household income in the United
States was $55,500 (New York Times website, August, 21, 2013). Answer the following
questions based on the following sample of 14 household incomes for 2013 (S1000s).
51.3
52.1
52.4
64.5
53.4
51.6
48.7
52.5
52.1
51.2
49.4
46.5
52.9
52.2
What is the median household income for the sample data for 2013?
b. Based on the sample data, estimate the percentage change in the median household
income from 2007 to 2013.
a.
c. Compute the first and third quartiles.
Transcribed Image Text:53.834 KB)
es 1 & 2 only).
PR 11-3A. You must SHOW YOUR WORK on
ut your work for EX11-9 in the submission box or
upplementary Exercises
157
d. Provide a five-number summary.
e. Using the z-score approach, do the data contain any outliers? Does the approach that
uses the values of the first and third quartiles and the interquartile range to detect outli-
ers provide the same results?
9. The data contained in the DATAfile named FoodIndustry show the company/chain name.
the average sales per store ($1000s), and the food segment industry for 47 restaurant
chains (Quick Service Restaurant Magazine website, August 2013).
What was the mean U.S. sales per store for the 47 restaurant chains?
b. What are the first and third quartiles? What is your interpretation of the quartiles?
Show a boxplot for the level of sales and discuss if there are any outliers in terms of
sales that would skew the results.
d. Develop a frequency distribution showing the average sales per store for each seg-
ment. Comment on the results obtained.
a.
C.
70. Travel + Leisure magazine provides an annual list of the 500 best hotels in the world.
The magazine provides a rating for each hotel along with a brief description that
includes the size of the hotel, amenities, and the cost per night for a double room. A
sample of 12 of the top-rated hotels in the United States follows
Hotel
Location
Rooms
Cost/Night
Boulders Resort & Spa
Disney's Wilderness Lodge
499
Phoenix, AZ
Orlando, FL
220
727
285
340
585
Expert Solution
This question has been solved!
Explore an expertly crafted, step-by-step solution for a thorough understanding of key concepts.

This is a popular solution!

Trending now
This is a popular solution!

Step by step
Solved in 2 steps

Recommended textbooks for you
MATLAB: An Introduction with Applications
Statistics
ISBN:
9781119256830
Author:
Amos Gilat
Publisher:
John Wiley & Sons Inc

Probability and Statistics for Engineering and th…
Statistics
ISBN:
9781305251809
Author:
Jay L. Devore
Publisher:
Cengage Learning

Statistics for The Behavioral Sciences (MindTap C…
Statistics
ISBN:
9781305504912
Author:
Frederick J Gravetter, Larry B. Wallnau
Publisher:
Cengage Learning
MATLAB: An Introduction with Applications
Statistics
ISBN:
9781119256830
Author:
Amos Gilat
Publisher:
John Wiley & Sons Inc
Probability and Statistics for Engineering and th…
Statistics
ISBN:
9781305251809
Author:
Jay L. Devore
Publisher:
Cengage Learning
Statistics for The Behavioral Sciences (MindTap C…
Statistics
ISBN:
9781305504912
Author:
Frederick J Gravetter, Larry B. Wallnau
Publisher:
Cengage Learning

Elementary Statistics: Picturing the World (7th E…
Statistics
ISBN:
9780134683416
Author:
Ron Larson, Betsy Farber
Publisher:
PEARSON

The Basic Practice of Statistics
Statistics
ISBN:
9781319042578
Author:
David S. Moore, William I. Notz, Michael A. Fligner
Publisher:
W. H. Freeman

Introduction to the Practice of Statistics
Statistics
ISBN:
9781319013387
Author:
David S. Moore, George P. McCabe, Bruce A. Craig
Publisher:
W. H. Freeman