A research centre was conducting a survey about how much money was sper secondary school student per day. The collected data was tabulated in Table Table 1 10 12 23 21 15 18 14 15 17 19 12 14 13 13 15 19 15 17 14 21 14 13 27 14 26 20 16 23 13 14
A research centre was conducting a survey about how much money was sper secondary school student per day. The collected data was tabulated in Table Table 1 10 12 23 21 15 18 14 15 17 19 12 14 13 13 15 19 15 17 14 21 14 13 27 14 26 20 16 23 13 14

Glencoe Algebra 1, Student Edition, 9780079039897, 0079039898, 2018
18th Edition
ISBN:9780079039897
Author:Carter
Publisher:Carter
Chapter10: Statistics
Section10.1: Measures Of Center
Problem 9PPS

Related questions
Question
PLEASE ANSWER QUICKLY
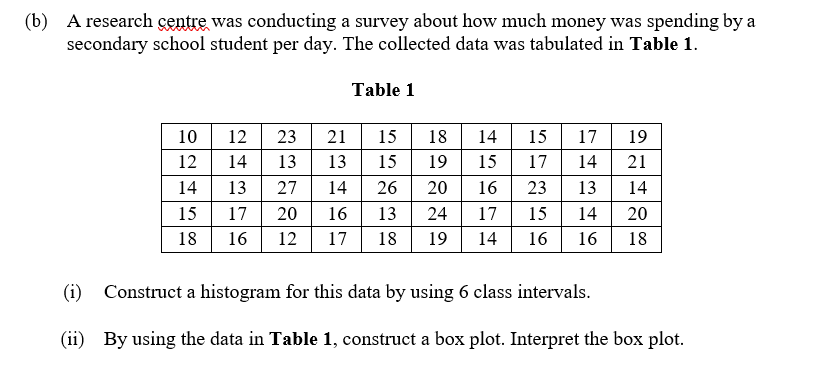
Transcribed Image Text:(b) A research centre was conducting a survey about how much money was spending by a
secondary school student per day. The collected data was tabulated in Table 1.
Table 1
10
12
23
21
15
18
14
15
17
19
12
14
13
13 15
19 15 17
14
21
14
13 27
14 26
20
16 23 13
14
15
17
16 13
24 17 15 14
20
20
16 12 17 18
18
19 14 16 16
18
(i) Construct a histogram for this data by using 6 class intervals.
(ii)
By using the data in Table 1, construct a box plot. Interpret the box plot.
Expert Solution
This question has been solved!
Explore an expertly crafted, step-by-step solution for a thorough understanding of key concepts.

Step by step
Solved in 3 steps with 4 images

Recommended textbooks for you
Glencoe Algebra 1, Student Edition, 9780079039897…
Algebra
ISBN:
9780079039897
Author:
Carter
Publisher:
McGraw Hill

Functions and Change: A Modeling Approach to Coll…
Algebra
ISBN:
9781337111348
Author:
Bruce Crauder, Benny Evans, Alan Noell
Publisher:
Cengage Learning
Glencoe Algebra 1, Student Edition, 9780079039897…
Algebra
ISBN:
9780079039897
Author:
Carter
Publisher:
McGraw Hill
Functions and Change: A Modeling Approach to Coll…
Algebra
ISBN:
9781337111348
Author:
Bruce Crauder, Benny Evans, Alan Noell
Publisher:
Cengage Learning