8. Shifts in supply or demand I The following graph shows the market for donuts in Chicago, where there are over 1.000 donut shops at any given moment. Suppose the municipal government, in an attempt to attract new residents, issues $1,000 move-in vouchers to each new household that moves to Chicago. As a result, many new families move into the city. Show the effect of this change on the market for donuts by shifting one or both of the curves on the following graph, holding all else constant. Note: Select and drag one or both of the curves to the desired position. Curves will snap into position, so if you try to move a curve and it snaps back to its original position, just drag it a little farther. Supply Demand Supply Demand QUANTITY (Donuts) Now suppose Congress passes a new tax that decreases the income of Chicago residents. If donuts are a normal good, this will cause the demand for donuts to increase PRICE (Dollars per donut)
8. Shifts in supply or demand I The following graph shows the market for donuts in Chicago, where there are over 1.000 donut shops at any given moment. Suppose the municipal government, in an attempt to attract new residents, issues $1,000 move-in vouchers to each new household that moves to Chicago. As a result, many new families move into the city. Show the effect of this change on the market for donuts by shifting one or both of the curves on the following graph, holding all else constant. Note: Select and drag one or both of the curves to the desired position. Curves will snap into position, so if you try to move a curve and it snaps back to its original position, just drag it a little farther. Supply Demand Supply Demand QUANTITY (Donuts) Now suppose Congress passes a new tax that decreases the income of Chicago residents. If donuts are a normal good, this will cause the demand for donuts to increase PRICE (Dollars per donut)

Principles of Economics 2e
2nd Edition
ISBN:9781947172364
Author:Steven A. Greenlaw; David Shapiro
Publisher:Steven A. Greenlaw; David Shapiro
Chapter3: Demand And Supply
Section: Chapter Questions
Problem 55P: Table 3.9 illustrates the markets demand and supply for cheddar cheese. Graph the data and find the...

Related questions
Question
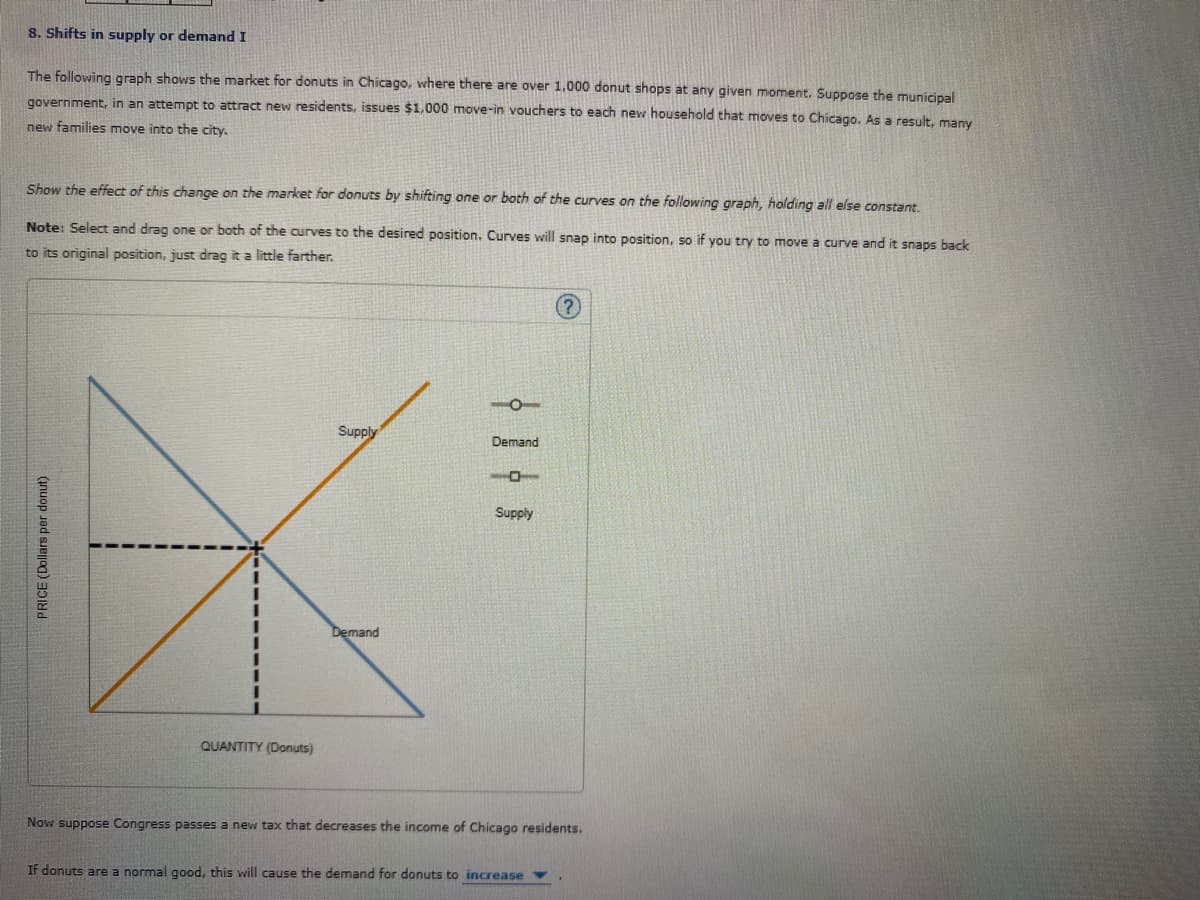
Transcribed Image Text:8. Shifts in supply or demand I
The following graph shows the market for donuts in Chicago, where there are over 1.000 donut shops at any given moment. Suppose the municipal
government, in an attempt to attract new residents, issues $1,000 move-in vouchers to each new household that moves to Chicago. As a result, many
new families move into the city.
Show the effect of this change on the market for donuts by shifting one or both of the curves on the following graph, holding all else constant.
Note: Select and drag one or both of the curves to the desired position. Curves will snap into position, so if you try to move a curve and it snaps back
to its original position, just drag it a little farther.
Supply
Demand
Supply
Demand
QUANTITY (Donuts)
Now suppose Congress passes a new tax that decreases the income of Chicago residents.
If donuts are a normal good, this will cause the demand for donuts to increase
PRICE (Dollars per donut)
Expert Solution
Step 1
Answer:
If the government issues a $1,000 move-in-vouchers then more people will come to Chicago. Since they will get a $1,000 voucher they will increase the demand for donuts and the demand curve of donuts will shift to the right.
There will be no change in the supply curve.
Graphical presentation:
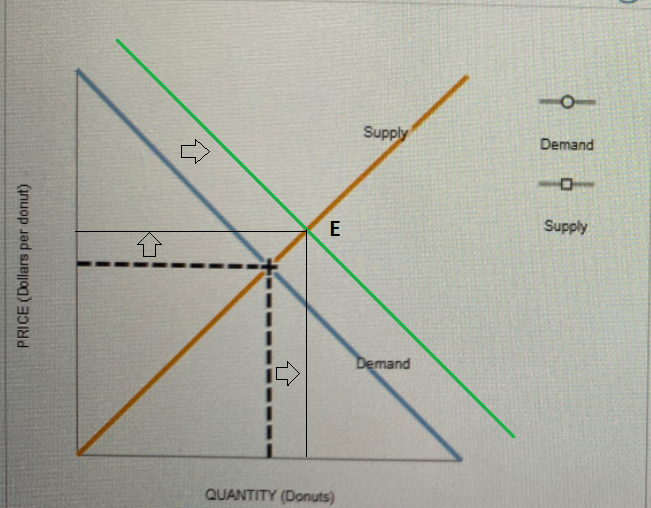
According to the above figure, the demand curve shifts to the right. As a result, the new equilibrium occurs at point E. The equilibrium price of donuts rises and the quantity also rises.

Trending now
This is a popular solution!

Step by step
Solved in 2 steps with 1 images

Knowledge Booster


Learn more about
Need a deep-dive on the concept behind this application? Look no further. Learn more about this topic, economics and related others by exploring similar questions and additional content below.Recommended textbooks for you
Principles of Economics 2e
Economics
ISBN:
9781947172364
Author:
Steven A. Greenlaw; David Shapiro
Publisher:
OpenStax

Brief Principles of Macroeconomics (MindTap Cours…
Economics
ISBN:
9781337091985
Author:
N. Gregory Mankiw
Publisher:
Cengage Learning

Essentials of Economics (MindTap Course List)
Economics
ISBN:
9781337091992
Author:
N. Gregory Mankiw
Publisher:
Cengage Learning
Principles of Economics 2e
Economics
ISBN:
9781947172364
Author:
Steven A. Greenlaw; David Shapiro
Publisher:
OpenStax
Brief Principles of Macroeconomics (MindTap Cours…
Economics
ISBN:
9781337091985
Author:
N. Gregory Mankiw
Publisher:
Cengage Learning
Essentials of Economics (MindTap Course List)
Economics
ISBN:
9781337091992
Author:
N. Gregory Mankiw
Publisher:
Cengage Learning


Exploring Economics
Economics
ISBN:
9781544336329
Author:
Robert L. Sexton
Publisher:
SAGE Publications, Inc
