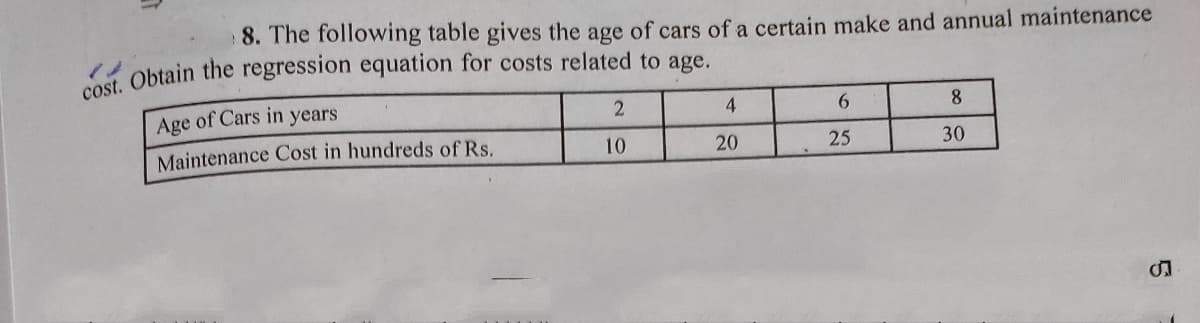
8. The following table gives the age of cars of a certain make and annual maintenance Age of Cars in years 6. 8 Maintenance Cost in hundreds of Rs. 10 20 25 30


Q: Suppose the following table shows the approximate price of a certain stock in December of each year…
A: The 4-yearly moving averages are computed by taking the average of the 4 year data and writing it…
Q: Assume the geometric mean of 6 profit growth ratios of a company is 1.2. What is the product of…
A: Consider a set of numbers x1, x2, …, xn of size n.
Q: What is the percentage of tires that last at least 35,000 miles? (3) In problem 1, suppose that the…
A:
Q: Suppose that the following data is the total annual incomes (rounded to thousands) for all 30 staffs…
A: Frequency distribution is used to know that, how the data is frequently repeated in a specified…
Q: Table shows the retailed prices and rate of cost of different daily necessary commodities from 1967…
A: Given: Food House rent Cloth Fuel Others Expenditure 25% 20% 20% 10% 25% Price 1967 100…
Q: age pioy Table 2.10(d) Wages Frequency $250.00–$259.99 8 260.00–269.99 10 270.00–279.99 16…
A: Given data, Class Lower limit Upper limit Midpoint (M) Frequency(fi) Mi*fi 250-259.99 250…
Q: 32. Estimate the annual premium payable at the age of 28 years from the ollowing data: Age (years)…
A:
Q: According to a high-profile realtor, houses in the sleepy town of Sun Beach have shown higher…
A: As per the honor code, the first three sub-parts will be solved. Dear student, repost the question…
Q: (a) For Region 2, what is the average rate of change per year in price from 2002 to 2005? (b) Use…
A: I have done the questions according to multiple subpart rules.
Q: Suppose that in a family savings equation, for the years 1990, 1991, and 1992, we let kidsit denote…
A: Introduction: The unobserved effects model for the ith observation for a time series data with k…
Q: The following table gives the approximate increase in dollars in the average price of a gallon of…
A: The table gives approximate increase in dollars in the average price of gallon of gas for every year…
Q: Consider the following excerpt from an article: The average person spends $ 5000.00 on traditional…
A: Two major divisions of statistics are described as descriptive statistics, through which the…
Q: 1. Create a Table of Expenses of your family in a week. ( 2. List the number of expenses for each…
A: Lets create a table of our expenses in a month Let the monthly income for Mr. X is 14400 rupees
Q: 13. Estimate the number of employees earning at least 63 but less than Rs 75 from the following…
A:
Q: Which of the following conclusions is not supported by data in the graph? 1. The ratio of biomass…
A: The extraction of all four types of natural resources - biomass, minerals, metals and fossils fuels…
Q: The following table gives the prices of some food items in the base year and current year and the…
A: Given data is : COMMODITY 2000 2005 PRICE $ QUANTITY PRICE $ QUANTITY A 15 15 22 12 B 20 5…
Q: The following chart shows "living wage" jobs in Rochester per 1000 working age adults over a 5 year…
A:
Q: A five-year project requires an investment of -112 and has the following cash flows in years 1…
A: We will solve this question using Cauchy's bounds theorem on a polynomial of degree "n". Here, we…
Q: The following is two years monthly sales data of 5 different outlets of a well-known textile brand.…
A: I have used Excel and the command is as follows: Data >> Data analysis >> Anova : single…
Q: 3. The annual number of burglaries in a town rose by 50% in 2012 and fell by 10% in 2013. Hence the…
A: According to guidelines, We can solve one question at a time, and three subparts formiste Given,…
Q: The following table represents the percentage change in bank deposits of the four largest commercial…
A: Given information: The data represents the percentage change in bank deposits for the four largest…
Q: The following table shows the daily receipts in millions of dollars of the movie "The Hunger Games"…
A:
Q: Example 7.2. From the following table, estimate the number of students who obtained marks between 40…
A:
Q: 7 Draw an ogive cure from the data given below. Profits (Rs in lakhs) No. of Shops 10-20 6. 20-30 8.…
A:
Q: - Determine the mode graphically from the following series: Week wages in Rupees Number of workers…
A:
Q: Assume that the following human capital earnings function has been estimated from a sample of…
A: Given the regression equation for human capital earnings function as W=1000+500×S+400×EXP-10×EXP2
Q: Suppose the following table shows the approximate price of a certain stock in December of each year…
A:
Q: In a table of “Sales as a % of Moving Average” over a 5-year period the adjusted average of the four…
A:
Q: The table below shows the income for an emplovee over his first five years ofr work. Use this to…
A: Hello! As you have posted more than 3 sub parts, we are answering the first 3 sub-parts. In case…
Q: 9. Draw more than ogive for the following data. Income (Rs): 10-20 20-30 30-40 40-50 50-60 60-70 No.…
A:
Q: 43. When presenting his annual report, a businessman displayed the following graphs representing his…
A: Given Revenue graph and Expenses graph We know Average Rate of growth = total growthtotal time…
Q: Write the null and alternate Hypothesis for the first two outputs. [1.5] Develop the…
A: The following table is obtained from the first two outputs Brand A = Group 1 Brand B = Group 2…
Q: Calculate the Karl Pearson 's coefficient of correction between expenditure and sales.
A: Given: Expenditure, X Sales, Y 39 47 65 53 62 58 90 86 82 62 75 68 25 60 98 91…
Q: Suppose a group of consumers spend 30% of their disposable income on food, 20% on clothing, and 50%…
A: Solution :-
Q: The following table shows the daily receipts in millions of dollars of the movie "The Hunger Games"…
A: The table showing the daily receipts in millions of dollars of the movie " The Hunger Games" after…
Q: The following table shows the time spent by 200 students in watching television programs during in…
A:
Q: If the national economy shrank at an annual rate of 6% per year for three consecutive years, then…
A: Given that economy shrank at an annual rate of 6% per year for three consecutive years, then the…
Q: Suppose you run a library and the cost of a particular journal you carry has increased over a ten…
A: Given increased over a ten year period from $14 to $35
Q: 10.- The percentages of osteopathic doctors who are women are given in the table for various years.…
A: It is given that 'p' is the percentage of osteopathic doctors who are women at t years since 1980.…
Q: The table below shows monthly data collected on production costs and on the number of units produced…
A: Given information: The data represents the values of the variables Total production costs and level…
Q: Suppose that the rate of return for a particular stock during the past two years was 20% and 30%.…
A:
Q: 7. Give 5 types of information collected by surveillance system. TABLE 1 Original Enrolment Dead at…
A: There are 3141 nondiabetic men and 185 diabetic men. So the ratio is 3141: 185 Answer(A): 3141 :…
Q: 6. Present the following data by a suitable diagram showing. The sales and net profits of a private…
A: Solution:
Q: Refer to the comparison line graph which shows how the net worth of Claire Kozar's retirement…
A: Consider the graph provided in question. The graph represents the retirement savings at different…
Q: 1) The following table gives the age-adjusted cancer incidence rates (new cases) per 100,000 people…
A: As per guidelines, we will only answer first question, for more solutions please repost the other…
Q: Suppose that the following data is the total annual incomes (rounded to thousands) for all 30 staffs…
A: lower quartile =l+N4-fcfQ ×wupper quartile=l+3N4-fcfQ×wwhere , l= lower class limit of the quartile…
Q: 9. The following table shows data for the cost of natural gas in Maryland (in dollars per Million…
A: Hello, Thanks for posting your question here. Since you have posted a question with multiple…
Q: A population starts with 16 carpet beetles and in a week the population increase by 1 new beetle for…
A: given data is Week 0 week 1 week 2 week 3 week 4 week 5 16 20 25 31 39 49 according to…
Q: The table below shows percentage changes (x) in the Dow-Jones index over the first five trading days…
A: 1) The correlation coefficient is as follows:
Q: The following table shows the daily receipts in millions of dollars of the movie "The Hunger Games"…
A:


Trending now
This is a popular solution!

Step by step
Solved in 2 steps with 2 images

- Suppose a group of consumers spend 30% of their disposable income on food, 20% on clothing, and 50% on rent. If over the course of a year the price of food rises 10%, the price of clothing drops 5% and rent rises 15%, what is the average price increase experienced by these consumers?Suppose that you would like to create composite indexes from three stocks: stk1, stk2, stk3. Their stock prices (Pt) and total shares outstanding (Qt) from day 0 to day 1 are shown as follows: stk3 splits two-for-one in day 1. P0 Q0 P1 Q1 stk1 40 250 50 250 stk2 50 100 50 100 stk3 60 150 50 300 Which answer is the closest value to the rate of return on a price-weighted index of the three stocks? A. 20% B. 25% C. 30% D. 35%if in a 2 party race, party 1 is leading in the age category 45 years and under by 10% and that category represents 60% of the electorate and party #2 is leading in the over 45 years by 10% and that category represents 40% of the electorate. Show in percentage the deficit that party 2 needs to make up.
- A life insurance company has 1,500 policies averaging Rs. 2,000 on lives at the age 30. From the past experience, it is found that out of 1,00,000 alive at the age of 30; while 99,000 are alive at age 3 Find the lower and the upper value of the amount that the company will have to payout in insurance during the year.If my bus is 3.5 years old, what are the projected annual maintenance costs? (Enter a whole number) Age of Bus(years)Annual Maintenance Cost($)2.4 3502.3 3702.4 4803.1 5203 5905.8 5504.8 7503.8 8003.6 7904.9 9505.5 915How to calculate Samsung’s cost (C(Q)) of producing 1,2,...15
- Suppose that a company has determined that a 70% experience curve accurately describes the evolution of its production costs for a new line. If the first unit costs $100 to produce, what should the 1,000th unit cost based on the experience curve?A company studied the number of lost-time accidents occurring at its Brownsville, Texas, plant. Historical records show that 6% of the employees suffered lost-time accidents last year. Management believes that a special safety program will reduce such accidents to 4% during the current year. In addition, it estimates that 15% of employees who had lost-time accidents last year will experience a lost-time accident during the current year. a. What percentage of the employees will experience lost-time accidents in both years (to 2 decimals)? % b. What percentage of the employees will suffer at least one lost-time accident over the two-year period (to 2 decimals)?The following table shows the average monthly distance traveled (in billion miles) by vehicles on urban highways for five different years. Urban Highways - Average Monthly Distance Traveled by Vehicles (Billion Miles) Years Jan Feb Mar Apr May Jun July Aug Sep Oct Nov Dec Year 1 4.22 5.32 5.21 5.12 4.92 4.49 4.55 4.49 4.44 4.39 4.37 4.35 Year 2 4.31 5.44 5.34 5.24 4.98 4.59 4.68 4.65 4.61 4.68 4.74 4.79 Year 3 4.38 5.51 5.41 5.36 4.98 4.63 4.71 4.78 4.82 4.88 4.85 4.89 Year 4 4.45 5.59 5.5 5.41 5.01 4.72 4.78 4.79 4.82 4.92 5.06 5.11 Year 5 4.51 5.65 5.62 5.49 5.12 4.8 4.88 4.82 4.95 5.12 5.22 5.44 a. Construct a time series plot. What type of pattern exists in the data?
- If the national economy shrank at an annual rate of 6% per year for three consecutive years, then the economy shrank by 18% over the three-year period. The statement is false because each year is a different reference value. The economy actually shrank ____ % over the three-year period.Suppose that we identify 155 women 50 to 54 years of age who have both a mother and a sister with a history of breast cancer. 18 of these women themselves have developed breast cancer at some time in their lives. If we assume that the proportion of breast cancer cases in women whose mothers have had breast cancer is 8%, does having a sister with the disease increase the risk? Find the p-value.1) If the sum of the squares of five numbers is 165 and their variance is 8. What is the mean of numbers? 2) A man invested 1000 Pesos per month on a bank that offers 6% interest compounded annually. How much can he get after 5 years? 3) A vessel is in a form of an inverted regular square pyramid of altitude 250 mm and base edge 160 mm. The depth of the water contains is 150mm. How much will the surface area rise when 0.5L of water is added.