The following table shows the daily receipts in millions of dollars of the movie "The Hunger Games" after its opening on 23 March 2012. Days $Receipts 21 21.096 35 10.814 49 4.505 63 2.311 77 1.072 91 0.624 105 0.315 119 0.182 Find the average rate of change of the daily receipts from day 21 to day 49. $ millions / day %24
The following table shows the daily receipts in millions of dollars of the movie "The Hunger Games" after its opening on 23 March 2012. Days $Receipts 21 21.096 35 10.814 49 4.505 63 2.311 77 1.072 91 0.624 105 0.315 119 0.182 Find the average rate of change of the daily receipts from day 21 to day 49. $ millions / day %24

Glencoe Algebra 1, Student Edition, 9780079039897, 0079039898, 2018
18th Edition
ISBN:9780079039897
Author:Carter
Publisher:Carter
Chapter10: Statistics
Section10.6: Summarizing Categorical Data
Problem 31PPS

Related questions
Question
100%
The following table shows the daily receipts in millions of dollars of the movie "The Hunger Games" after its opening on 23 March 2012.
Thank you, will up vote
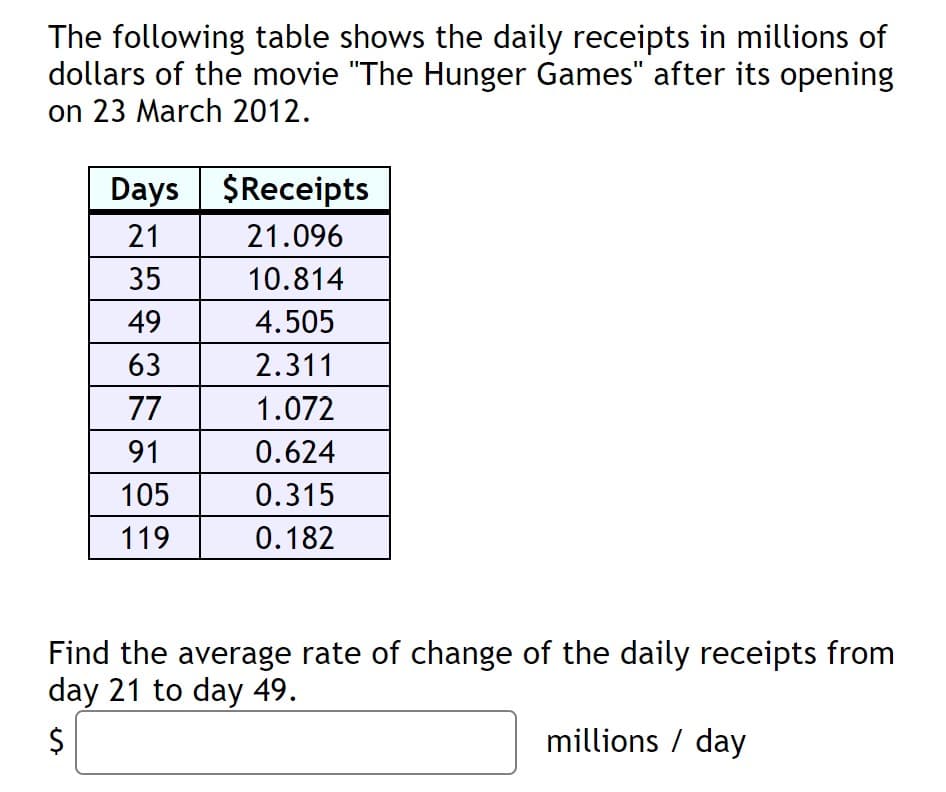
Transcribed Image Text:The following table shows the daily receipts in millions of
dollars of the movie "The Hunger Games" after its opening
on 23 March 2012.
Days $Receipts
21
21.096
35
10.814
49
4.505
63
2.311
77
1.072
91
0.624
105
0.315
119
0.182
Find the average rate of change of the daily receipts from
day 21 to day 49.
millions / day
%24
Expert Solution
This question has been solved!
Explore an expertly crafted, step-by-step solution for a thorough understanding of key concepts.

This is a popular solution!

Trending now
This is a popular solution!

Step by step
Solved in 2 steps with 1 images

Knowledge Booster


Learn more about
Need a deep-dive on the concept behind this application? Look no further. Learn more about this topic, calculus and related others by exploring similar questions and additional content below.Recommended textbooks for you
Glencoe Algebra 1, Student Edition, 9780079039897…
Algebra
ISBN:
9780079039897
Author:
Carter
Publisher:
McGraw Hill
Glencoe Algebra 1, Student Edition, 9780079039897…
Algebra
ISBN:
9780079039897
Author:
Carter
Publisher:
McGraw Hill