800 700 600 500 400 300 200 100 5 10 15 20 25 30 Twenty five high school students complete a preparation program for taking the SAT test. Here are the SAT scores from the 25 students who completed the SAT prep program: 434 694 457 534 720 400 484 478 610 641 425 636 454514 563 370 499 640 501 625 612 471 598 509 531 The mean of these scores is 536.00. We know that the population average for SAT scores is 500 with a standard deviation of 100. Using the scatterplot above, are there any outliers?
800 700 600 500 400 300 200 100 5 10 15 20 25 30 Twenty five high school students complete a preparation program for taking the SAT test. Here are the SAT scores from the 25 students who completed the SAT prep program: 434 694 457 534 720 400 484 478 610 641 425 636 454514 563 370 499 640 501 625 612 471 598 509 531 The mean of these scores is 536.00. We know that the population average for SAT scores is 500 with a standard deviation of 100. Using the scatterplot above, are there any outliers?

Glencoe Algebra 1, Student Edition, 9780079039897, 0079039898, 2018
18th Edition
ISBN:9780079039897
Author:Carter
Publisher:Carter
Chapter10: Statistics
Section: Chapter Questions
Problem 19SGR

Related questions
Question
Transcribed Image Text:800
700
600
500
400
300
200
100
5
10
15
20
25
30
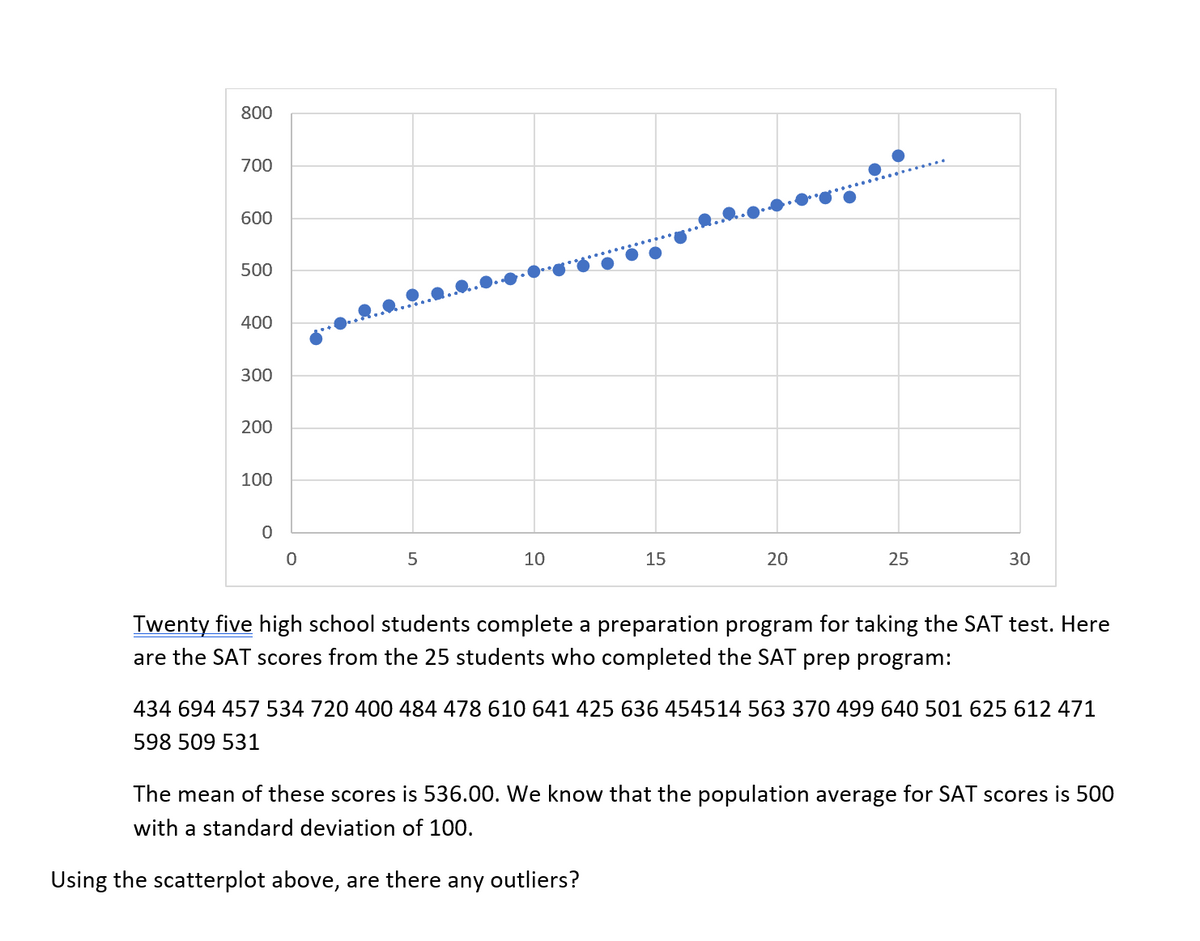
Twenty five high school students complete a preparation program for taking the SAT test. Here
are the SAT scores from the 25 students who completed the SAT prep program:
34
457 53
720 400 484
610 641 425
454514
499 64
501 625
2 471
598 509 531
The mean of these scores is 536.00. We know that the population average for SAT scores is 500
with a standard deviation of 100.
Using the scatterplot above, are there any outliers?
Expert Solution
This question has been solved!
Explore an expertly crafted, step-by-step solution for a thorough understanding of key concepts.

This is a popular solution!

Trending now
This is a popular solution!

Step by step
Solved in 2 steps

Recommended textbooks for you
Glencoe Algebra 1, Student Edition, 9780079039897…
Algebra
ISBN:
9780079039897
Author:
Carter
Publisher:
McGraw Hill
Glencoe Algebra 1, Student Edition, 9780079039897…
Algebra
ISBN:
9780079039897
Author:
Carter
Publisher:
McGraw Hill