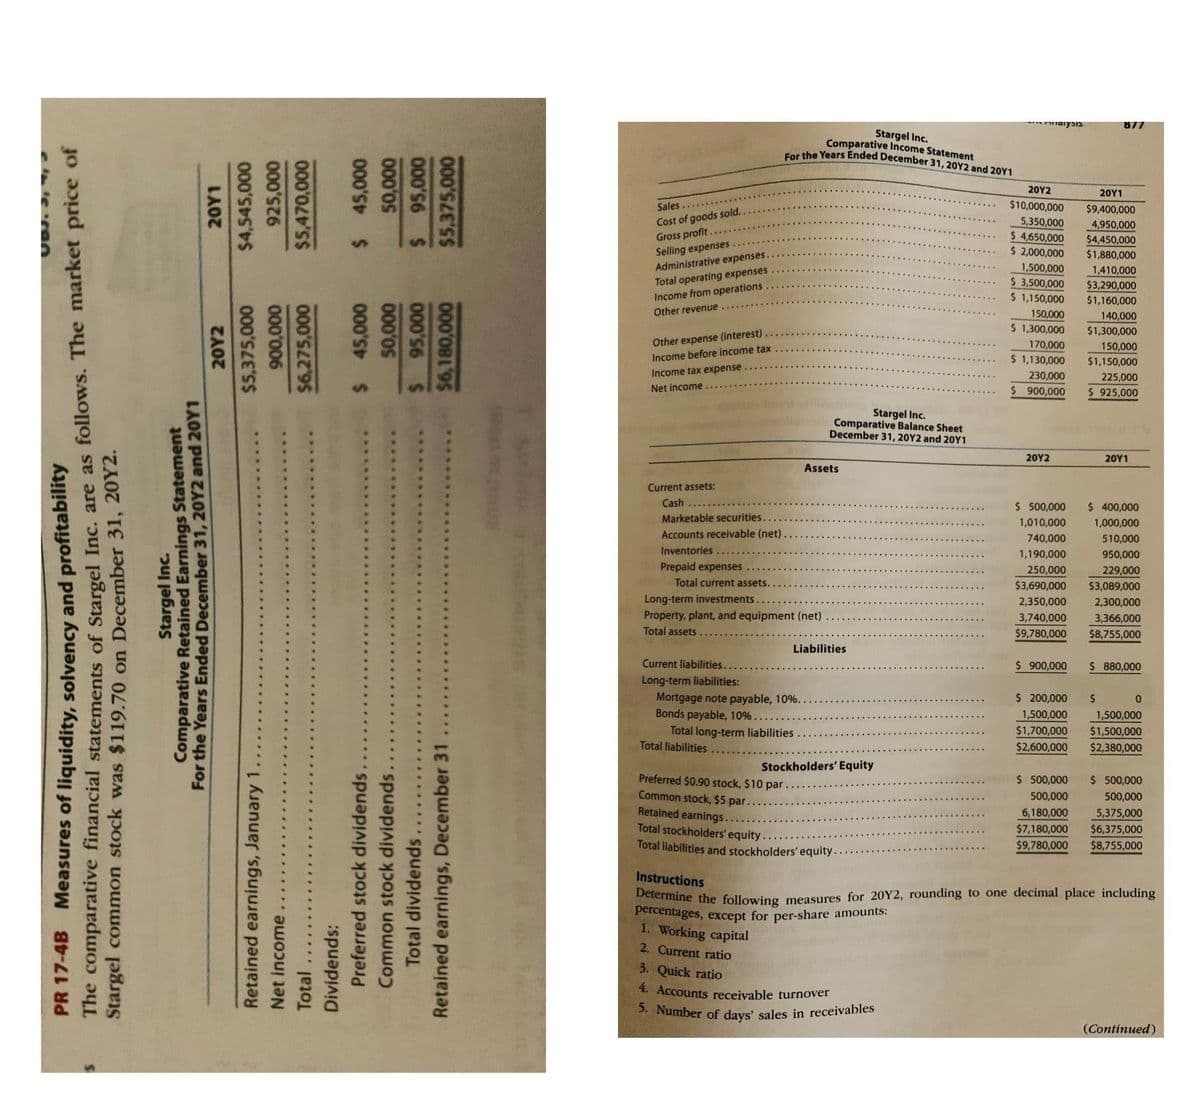
877 Stargel Inc. Comparative Income Statement the Years Ended December 31, 20Y2 and 20Y1 20Υ2 20Υ1 Sales...... $10,000,000 $9,400,000 Cost of goods sold. Gross profit Selling expenses. Administrative expenses. 5,350,000 $ 4,650,000 $ 2,000,000 4,950,000 $4,450,000 $1,880,000 Total operating expenses Income from operations Other revenue. 1,500,000 $ 3,500,000 $ 1,150,000 150,000 $ 1,300,000 1,410,000 $3,290,000 $1,160,000 140,000 $1,300,000 Other expense (interest) Income before income tax Income tax expense. Net income. 170,000 $ 1,130,000 150,000 $1,150,000 230,000 225,000 $ 900,000 $ 925,000 Stargel Inc. Comparative Balance Sheet December 31, 20Y2 and 20Y1 20Y2 20Υ1 Assets Current assets: Cash $ 500,000 1,010,000 $ 400,000 Marketable securities. 1,000,000 Accounts receivable (net) 740,000 510,000 Inventories... 1,190,000 950,000 Prepaid expenses 250,000 $3,690,000 2,350,000 229,000 Total current assets. $3,089,000 Long-term investments. Property, plant, and equipment (net) Total assets. 2,300,000 3,740,000 $9,780,000 3,366,000 $8,755,000 Liabilities Current liabilities.. $ 900,000 $ 880,000 Long-term liabilities: Mortgage note payable, 10%. Bonds payable, 10%. Total long-term liabilities Total liabilities $ 200,000 1,500,000 1,500,000 $1,700,000 $2,600,000 $1,500,000 $2,380,000 Stockholders' Equity Preferred $0.90 stock, $10 par.. Common stock, $5 par. Retained earnings. Total stockholders' equity.. Total liabilities and stockholders' equity. $ 500,000 $ 500,000 500,000 500,000 6,180,000 $7,180,000 5,375,000 $6,375,000 $8,755,000 $9,780,000 Instructions Determine the following measures for 20Y2, rounding to one decimal place including percentages, except for per-share amounts: 1. Working capital 2. Current ratio 3. Quick ratio 1. Accounts receivable turnover 5. Number of days' sales in receivables (Continued) PR 17-4B Measures of liquidity, solvency and profitability Stargel common stock was $119.70 on December 31, 20Y2. The comparative financial statements of Stargel Inc. are as follows. The market price of Stargel Inc. Comparative Retained Earnings Statement For the Years Ended December 31, 20Y2 and 20Y1 Retained earnings, January Net income Total Dividends: Preferred stock dividends. Common stock dividends. Total dividends........ Retained earnings, December 31
877 Stargel Inc. Comparative Income Statement the Years Ended December 31, 20Y2 and 20Y1 20Υ2 20Υ1 Sales...... $10,000,000 $9,400,000 Cost of goods sold. Gross profit Selling expenses. Administrative expenses. 5,350,000 $ 4,650,000 $ 2,000,000 4,950,000 $4,450,000 $1,880,000 Total operating expenses Income from operations Other revenue. 1,500,000 $ 3,500,000 $ 1,150,000 150,000 $ 1,300,000 1,410,000 $3,290,000 $1,160,000 140,000 $1,300,000 Other expense (interest) Income before income tax Income tax expense. Net income. 170,000 $ 1,130,000 150,000 $1,150,000 230,000 225,000 $ 900,000 $ 925,000 Stargel Inc. Comparative Balance Sheet December 31, 20Y2 and 20Y1 20Y2 20Υ1 Assets Current assets: Cash $ 500,000 1,010,000 $ 400,000 Marketable securities. 1,000,000 Accounts receivable (net) 740,000 510,000 Inventories... 1,190,000 950,000 Prepaid expenses 250,000 $3,690,000 2,350,000 229,000 Total current assets. $3,089,000 Long-term investments. Property, plant, and equipment (net) Total assets. 2,300,000 3,740,000 $9,780,000 3,366,000 $8,755,000 Liabilities Current liabilities.. $ 900,000 $ 880,000 Long-term liabilities: Mortgage note payable, 10%. Bonds payable, 10%. Total long-term liabilities Total liabilities $ 200,000 1,500,000 1,500,000 $1,700,000 $2,600,000 $1,500,000 $2,380,000 Stockholders' Equity Preferred $0.90 stock, $10 par.. Common stock, $5 par. Retained earnings. Total stockholders' equity.. Total liabilities and stockholders' equity. $ 500,000 $ 500,000 500,000 500,000 6,180,000 $7,180,000 5,375,000 $6,375,000 $8,755,000 $9,780,000 Instructions Determine the following measures for 20Y2, rounding to one decimal place including percentages, except for per-share amounts: 1. Working capital 2. Current ratio 3. Quick ratio 1. Accounts receivable turnover 5. Number of days' sales in receivables (Continued) PR 17-4B Measures of liquidity, solvency and profitability Stargel common stock was $119.70 on December 31, 20Y2. The comparative financial statements of Stargel Inc. are as follows. The market price of Stargel Inc. Comparative Retained Earnings Statement For the Years Ended December 31, 20Y2 and 20Y1 Retained earnings, January Net income Total Dividends: Preferred stock dividends. Common stock dividends. Total dividends........ Retained earnings, December 31

Managerial Accounting
15th Edition
ISBN:9781337912020
Author:Carl Warren, Ph.d. Cma William B. Tayler
Publisher:Carl Warren, Ph.d. Cma William B. Tayler
Chapter15: Statement Of Cash Flows
Section: Chapter Questions
Problem 9BE

Related questions
Question
a spreedsheet is needed to complete for this question. PR17-04b from Cegage accounting 2 (financial statement analysis)
Transcribed Image Text:5. Number of days' sales in receivables
** naiysIS
877
Stargel Inc.
Comparative Income Statement
ar the Years Ended December 31, 20Y2 and 20Y1
20Υ2
20Υ1
Sales...
$10,000,000
$9,400,000
Cost of goods sold.
Gross profit.
Selling expenses
Administrative expenses
5,350,000
$ 4,650,000
$ 2,000,000
4,950,000
$4,450,000
$1,880,000
Total operating expenses
Income from operations
Other revenue.....
1,500,000
$ 3,500,000
$ 1,150,000
1,410,000
$3,290,000
$1,160,000
150,000
140,000
$ 1,300,000
$1,300,000
Other expense (interest)
Income before income tax
170,000
150,000
$ 1,130,000
$1,150,000
Income tax expense.
230,000
225,000
Net income
$ 900,000
$ 925,000
Stargel Inc.
Comparative Balance Sheet
December 31, 20Y2 and 20Y1
20Υ2
20Υ1
Assets
Current assets:
Cash
$ 500,000
$ 400,000
Marketable securities.
1,010,000
1,000,000
Accounts receivable (net)
740,000
510,000
Inventories
1,190,000
950,000
Prepaid expenses
250,000
229,000
Total current assets.
$3,690,000
$3,089,000
Long-term investments
Property, plant, and equipment (net)
2,350,000
2,300,000
3,740,000
3,366,000
Total assets
$9,780,000
$8,755,000
Liabilities
Current liabilities..
$ 900,000
$ 880,000
Long-term liabilities:
Mortgage note payable, 10%.
Bonds payable, 10%..
Total long-term liabilities
Total liabilities
$ 200,000
1,500,000
1,500,000
$1,700,000
$1,500,000
$2,600,000
$2,380,000
Stockholders' Equity
Preferred $0.90 stock, $10 par
Common stock, $5 par.
Retained earnings...
Total stockholders' equity.
Total liabilities and stockholders' equity..
$ 500,000
$ 500,000
500,000
500,000
6,180,000
5,375,000
$7,180,000
$6,375,000
$9,780,000
$8,755,000
Instructions
Determine the following measures for 20Y2, rounding to one decimal place including
percentages, except for per-share amounts:
1. Working capital
2. Current ratio
3. Quick ratio
4. Accounts receivable turnover
(Continued)
PR 17-4B
Measures of liquidity, solvency and profitability
The comparative financial statements of Stargel Inc. are as follows. The market price of
Stargel common stock was $119.70 on December 31, 20Y2.
Stargel Inc.
Comparative Retained Earnings Statement
For the Years Ended December 31, 20Y2 and 20Y1
Retained earnings, January 1.
Net income....
Total
Dividends:
Preferred stock dividends.
Common stock dividends.
Total dividends.
Retained earnings, December 31
Transcribed Image Text:111111|
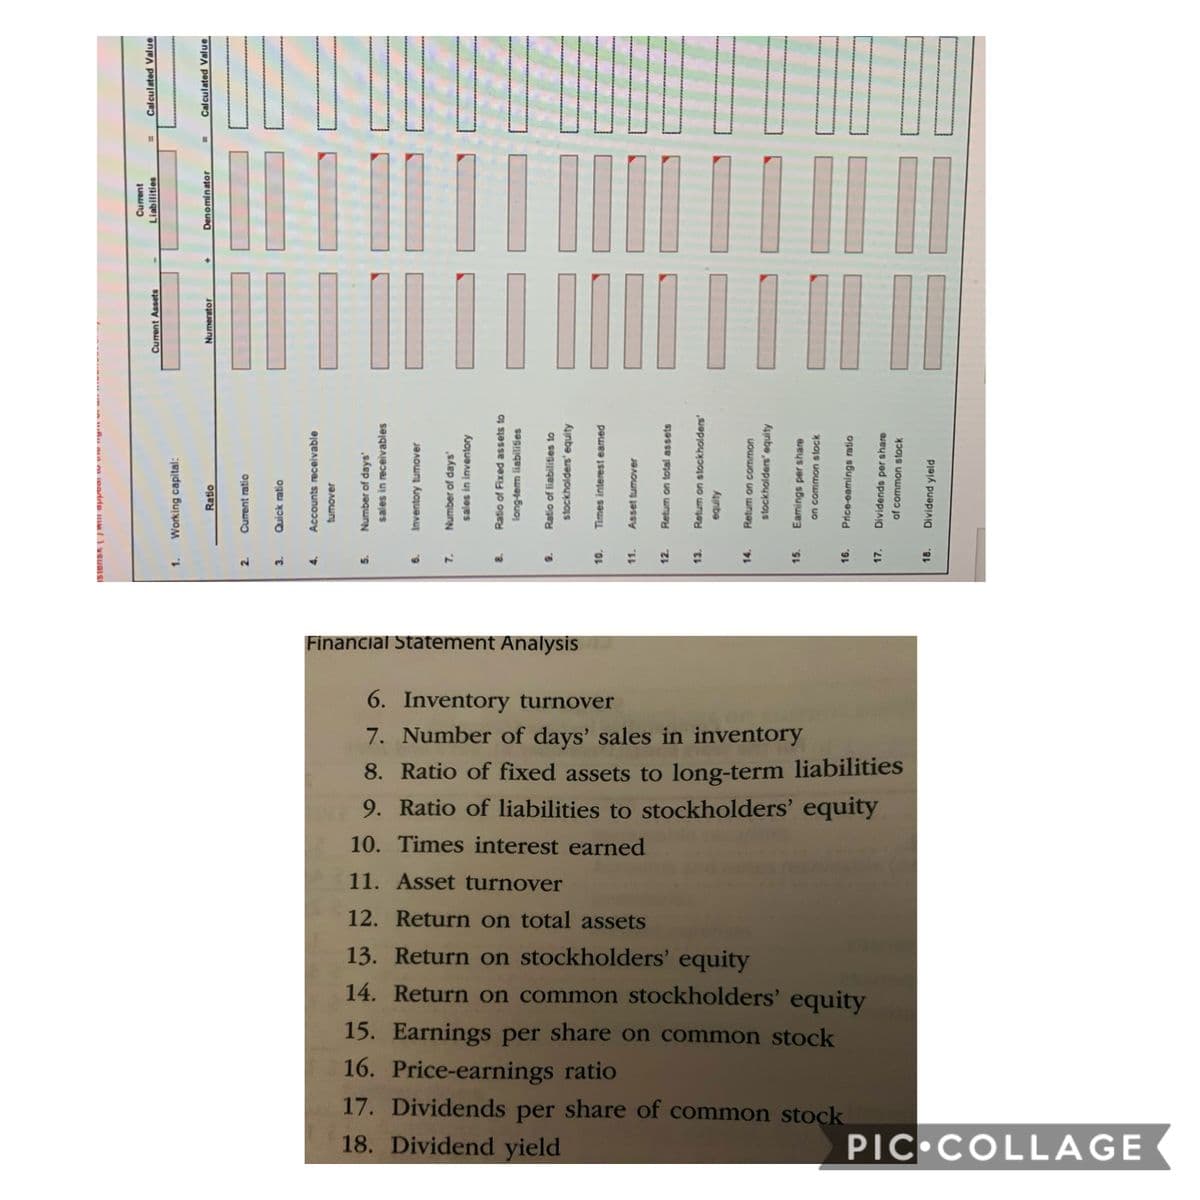
Financial Statement Analysis
6. Inventory turnover
7. Number of days' sales in inventory
8. Ratio of fixed assets to long-term liabilities
9. Ratio of liabilities to stockholders' equity
10. Times interest earned
11. Asset turnover
12. Return on total assets
13. Return on stockholders' equity
14. Return on common stockholders' equity
15. Earnings per share on common stock
16. Price-earnings ratio
17. Dividends per share of common stock
18. Dividend yield
PIC COLLAGE
Ipadde u vsuaIS
Current
Liabilities
= Calculated Value
Current Assets
Working capital:
Denominator
- Calculated Value
Ratio
Numerator
2.
Curent ratio
Quick ratio
3.
Accounts receivable
5.
Number of days'
sales in receivables
6.
Inventory tumover
7.
Number of days'
sales in inventory
Ratio of Fixed assets to
long-tem liabilities
Ratio of liabilities to
stockholders' equity
10.
Times interest eamed
11.
Asset tumover
12.
Retum on total assets
13.
Retum on stockholders'
Ainbe
14.
Retum on common
stockholders' equity
15.
Eamings per share
on common stock
16.
Price-eamings ratio
17.
Dividends per share
of common stock
18.
Dividend yield
Expert Solution
This question has been solved!
Explore an expertly crafted, step-by-step solution for a thorough understanding of key concepts.

This is a popular solution!

Trending now
This is a popular solution!

Step by step
Solved in 2 steps

Knowledge Booster


Learn more about
Need a deep-dive on the concept behind this application? Look no further. Learn more about this topic, accounting and related others by exploring similar questions and additional content below.Recommended textbooks for you
Managerial Accounting
Accounting
ISBN:
9781337912020
Author:
Carl Warren, Ph.d. Cma William B. Tayler
Publisher:
South-Western College Pub

Managerial Accounting: The Cornerstone of Busines…
Accounting
ISBN:
9781337115773
Author:
Maryanne M. Mowen, Don R. Hansen, Dan L. Heitger
Publisher:
Cengage Learning

Cornerstones of Financial Accounting
Accounting
ISBN:
9781337690881
Author:
Jay Rich, Jeff Jones
Publisher:
Cengage Learning
Managerial Accounting
Accounting
ISBN:
9781337912020
Author:
Carl Warren, Ph.d. Cma William B. Tayler
Publisher:
South-Western College Pub
Managerial Accounting: The Cornerstone of Busines…
Accounting
ISBN:
9781337115773
Author:
Maryanne M. Mowen, Don R. Hansen, Dan L. Heitger
Publisher:
Cengage Learning
Cornerstones of Financial Accounting
Accounting
ISBN:
9781337690881
Author:
Jay Rich, Jeff Jones
Publisher:
Cengage Learning

Survey of Accounting (Accounting I)
Accounting
ISBN:
9781305961883
Author:
Carl Warren
Publisher:
Cengage Learning

Fundamentals of Financial Management (MindTap Cou…
Finance
ISBN:
9781337395250
Author:
Eugene F. Brigham, Joel F. Houston
Publisher:
Cengage Learning
