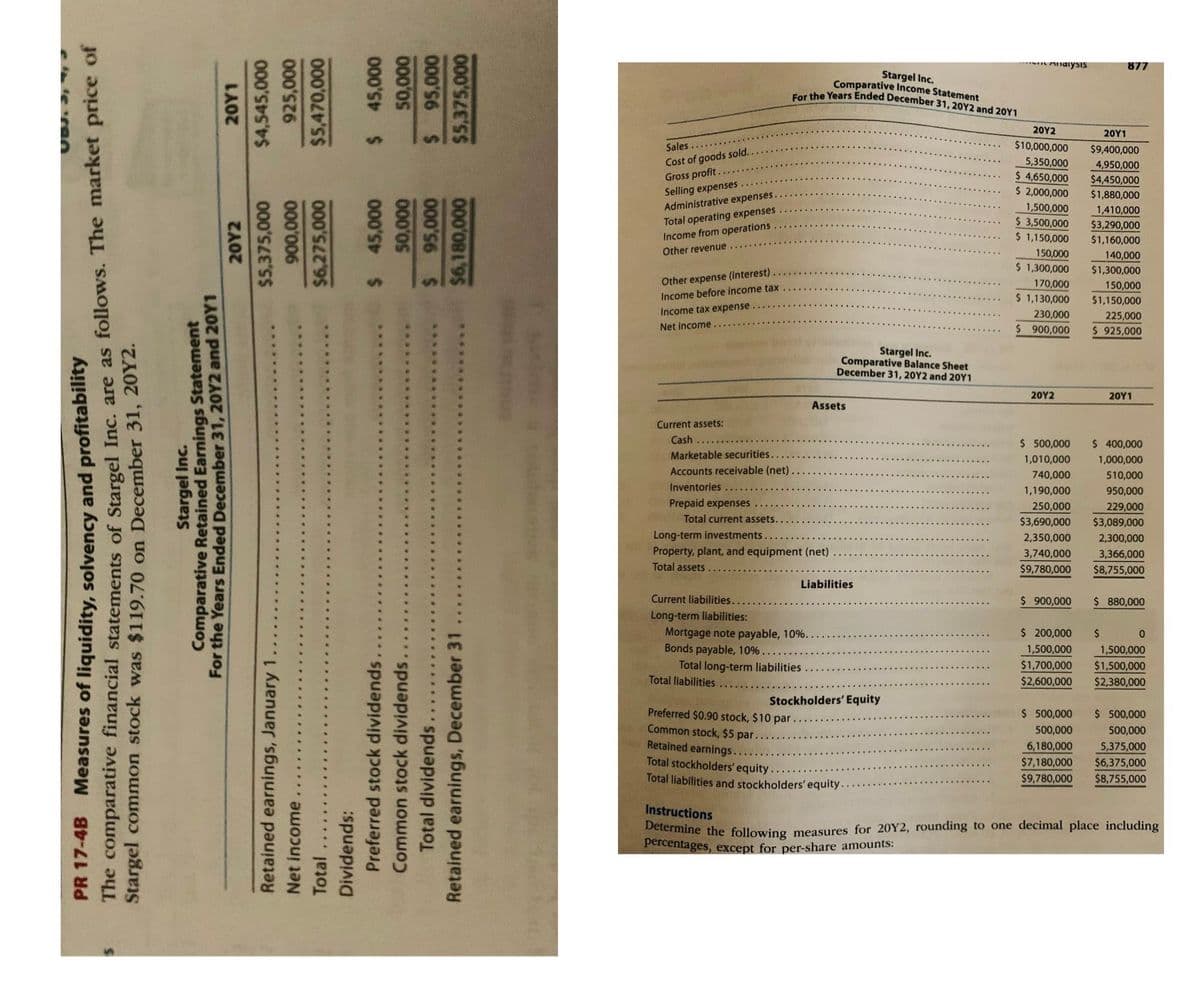
Jecember 31, 20Y2 and 20Y1 20Υ2 20Υ1 Sales... $10,000,000 $9,400,000 4,950,000 $4,450,000 $1,880,000 Cost of goods sold. Gross profit.. Selling expenses. Administrative expenses. Total operating expenses Income from operations Other revenue. 5,350,000 $ 4,650,000 $ 2,000,000 1,500,000 $ 3,500,000 $ 1,150,000 1,410,000 $3,290,000 $1,160,000 150,000 140,000 $ 1,300,000 $1,300,000 Other expense (interest) Income before income tax Income tax expense. 170,000 150,000 $ 1,130,000 $1,150,000 230,000 %$ 900,000 225,000 $ 925,000 Net income Stargel Inc. Comparative Balance Sheet December 31, 20Y2 and 20Y1 20Y2 20Υ1 Assets Current assets: Cash $ 500,000 $ 400,000 1,000,000 Marketable securities. 1,010,000 Accounts receivable (net) 740,000 510,000 Inventories Prepaid expenses Total current assets.. 1,190,000 950,000 250,000 229,000 $3,089,000 $3,690,000 Long-term investments. Property, plant, and equipment (net) Total assets 2,350,000 2,300,000 3,740,000 3,366,000 $9,780,000 $8,755,000 Liabilities Current liabilities... Long-term liabilities: Mortgage note payable, 10%. Bonds payable, 10%... Total long-term liabilities otal liabilities $ 900,000 $ 880,000 $ 200,000 %24 1,500,000 1,500,000 $1,700,000 $1,500,000 $2,600,000 $2,380,000 Stockholders' Equity referred $0.90 stock, $10 par. ommon stock, $5 par etained earnings.... otal stockholders equity. otal liabilities and stockholders' equity. $ 500,000 $ 500,000 500,000 ... 500,000 6,180,000 5,375,000 $7,180,000 $6,375,000 $9,780,000 $8,755,000 artrust!

Fundamentals of Financial Management (MindTap Course List)
15th Edition
ISBN:9781337395250
Author:Eugene F. Brigham, Joel F. Houston
Publisher:Eugene F. Brigham, Joel F. Houston
Chapter4: Analysis Of Financial Statements
Section: Chapter Questions
Problem 24P: Income Statement for Year Ended December 31, 2018 (Millions of Dollars) Net sales 795.0 Cost of...
icon
Related questions
icon
Concept explainers
Topic Video
Question
5.
Number of days'
sales in receivables
inancial Statement Analysis
6.
Inventory tumover
6. Inventory turnover
7.
Number of days'
sales in inventory
7. Number of days' sales in inventory
8. Ratio of fixed assets to long-term liabilities
9. Ratio of liabilities to stockholders' equity
8.
Ratio of Fixed assets to
long-tem liabiliies
9.
Ratio of liabilities to
stockholders' equity
10. Times interest earned
10.
Times interest eamed
11. Asset turnover
11.
Asset tumover
12. Return on total assets
12.
Retum on total assets
13. Return on stockholders' equity
13.
Retum on stockholders'
equity
14. Return on common stockholders' equity
14.
Retum on common
15. Earnings per share on common stock
stockholders' equity
16. Price-earnings ratio
15.
Eamings per share
on common stock
17. Dividends per share of common stock
16.
Price-eamings ratio
18. Dividend yield
17.
Dividends per share
of common stock
18.
Dividend yield
Transcribed Image Text:5. Number of days' sales in receivables inancial Statement Analysis 6. Inventory tumover 6. Inventory turnover 7. Number of days' sales in inventory 7. Number of days' sales in inventory 8. Ratio of fixed assets to long-term liabilities 9. Ratio of liabilities to stockholders' equity 8. Ratio of Fixed assets to long-tem liabiliies 9. Ratio of liabilities to stockholders' equity 10. Times interest earned 10. Times interest eamed 11. Asset turnover 11. Asset tumover 12. Return on total assets 12. Retum on total assets 13. Return on stockholders' equity 13. Retum on stockholders' equity 14. Return on common stockholders' equity 14. Retum on common 15. Earnings per share on common stock stockholders' equity 16. Price-earnings ratio 15. Eamings per share on common stock 17. Dividends per share of common stock 16. Price-eamings ratio 18. Dividend yield 17. Dividends per share of common stock 18. Dividend yield
Andiysis
877
Stargel Inc.
Comparative Income Statement
Ser the Years Ended December 31, 20Y2 and 20Y1
20Υ2
20Υ1
Sales
$10,000,000
$9,400,000
Cost of goods sold.
Gross profit
Selling expenses
Administrative expenses.
5,350,000
$ 4,650,000
$ 2,000,000
4,950,000
$4,450,000
$1,880,000
Total operating expenses
Income from operations
1,500,000
$ 3,500,000
$ 1,150,000
1,410,000
$3,290,000
$1,160,000
Other revenue
150,000
140,000
$ 1,300,000
$1,300,000
Other expense (interest)
Income before income tax
170,000
150,000
$ 1,130,000
$1,150,000
Income tax expense
230,000
225,000
Net income
$ 900,000
$ 925,000
Stargel Inc.
Comparative Balance Sheet
December 31, 20Y2 and 20Y1
20Υ2
20Υ1
Assets
Current assets:
Cash
$ 500,000
$ 400,000
Marketable securities.
1,010,000
1,000,000
Accounts receivable (net).
740,000
510,000
Inventories
1,190,000
950,000
Prepaid expenses
250,000
229,000
Total current assets.
$3,690,000
$3,089,000
Long-term investments.
Property, plant, and equipment (net)
Total assets
2,350,000
2,300,000
3,740,000
3,366,000
$9,780,000
$8,755,000
Liabilities
Current liabilities.
$ 900,000
$ 880,000
Long-term liabilities:
$ 200,000
Mortgage note payable, 10%.
Bonds payable, 10%..
Total long-term liabilities
Total liabilities
2$
1,500,000
1,500,000
$1,700,000
$1,500,000
$2,600,000
$2,380,000
Stockholders' Equity
Preferred $0.90 stock, $10 par
Common stock, $5 par
Retained earnings..
Total stockholders' equity..
Total liabilities and stockholders' equity..
$ 500,000
$ 500,000
500,000
500,000
6,180,000
5,375,000
$6,375,000
$7,180,000
$9,780,000
$8,755,000
Instructions
Determine the following measures for 20Y2, rounding to one decimal place including
percentages, except for per-share amounts:
PR 17-4B Measures of liquidity, solvency and profitability
Stargel common stock was $119.70 on December 31, 20Y2.
Stargel Inc.
Comparative Retained Earnings Statement
For the Years Ended December 31, 20Y2 and 20Y1
Retained earnings, January 1
Net income
Total.... ..
Dividends:
Preferred stock dividends
Common stock dividends
Total dividends
Retained earnings, December 31
Transcribed Image Text:Andiysis 877 Stargel Inc. Comparative Income Statement Ser the Years Ended December 31, 20Y2 and 20Y1 20Υ2 20Υ1 Sales $10,000,000 $9,400,000 Cost of goods sold. Gross profit Selling expenses Administrative expenses. 5,350,000 $ 4,650,000 $ 2,000,000 4,950,000 $4,450,000 $1,880,000 Total operating expenses Income from operations 1,500,000 $ 3,500,000 $ 1,150,000 1,410,000 $3,290,000 $1,160,000 Other revenue 150,000 140,000 $ 1,300,000 $1,300,000 Other expense (interest) Income before income tax 170,000 150,000 $ 1,130,000 $1,150,000 Income tax expense 230,000 225,000 Net income $ 900,000 $ 925,000 Stargel Inc. Comparative Balance Sheet December 31, 20Y2 and 20Y1 20Υ2 20Υ1 Assets Current assets: Cash $ 500,000 $ 400,000 Marketable securities. 1,010,000 1,000,000 Accounts receivable (net). 740,000 510,000 Inventories 1,190,000 950,000 Prepaid expenses 250,000 229,000 Total current assets. $3,690,000 $3,089,000 Long-term investments. Property, plant, and equipment (net) Total assets 2,350,000 2,300,000 3,740,000 3,366,000 $9,780,000 $8,755,000 Liabilities Current liabilities. $ 900,000 $ 880,000 Long-term liabilities: $ 200,000 Mortgage note payable, 10%. Bonds payable, 10%.. Total long-term liabilities Total liabilities 2$ 1,500,000 1,500,000 $1,700,000 $1,500,000 $2,600,000 $2,380,000 Stockholders' Equity Preferred $0.90 stock, $10 par Common stock, $5 par Retained earnings.. Total stockholders' equity.. Total liabilities and stockholders' equity.. $ 500,000 $ 500,000 500,000 500,000 6,180,000 5,375,000 $6,375,000 $7,180,000 $9,780,000 $8,755,000 Instructions Determine the following measures for 20Y2, rounding to one decimal place including percentages, except for per-share amounts: PR 17-4B Measures of liquidity, solvency and profitability Stargel common stock was $119.70 on December 31, 20Y2. Stargel Inc. Comparative Retained Earnings Statement For the Years Ended December 31, 20Y2 and 20Y1 Retained earnings, January 1 Net income Total.... .. Dividends: Preferred stock dividends Common stock dividends Total dividends Retained earnings, December 31
Expert Solution
trending now

Trending now

This is a popular solution!

steps

Step by step

Solved in 4 steps

Blurred answer
Knowledge Booster
Financial Statements
Learn more about
Need a deep-dive on the concept behind this application? Look no further. Learn more about this topic, accounting and related others by exploring similar questions and additional content below.
Similar questions
Recommended textbooks for you
Fundamentals of Financial Management (MindTap Cou…
Finance
ISBN:
9781337395250
Author:
Eugene F. Brigham, Joel F. Houston
Publisher:
Cengage Learning
Survey of Accounting (Accounting I)
Accounting
ISBN:
9781305961883
Author:
Carl Warren
Publisher:
Cengage Learning
Financial And Managerial Accounting
Accounting
ISBN:
9781337902663
Author:
WARREN, Carl S.
Publisher:
Cengage Learning,
Cornerstones of Financial Accounting
Accounting
ISBN:
9781337690881
Author:
Jay Rich, Jeff Jones
Publisher:
Cengage Learning
Financial Accounting: The Impact on Decision Make…
Accounting
ISBN:
9781305654174
Author:
Gary A. Porter, Curtis L. Norton
Publisher:
Cengage Learning
Intermediate Accounting: Reporting And Analysis
Accounting
ISBN:
9781337788281
Author:
James M. Wahlen, Jefferson P. Jones, Donald Pagach
Publisher:
Cengage Learning