f. Conduct a two-tailed comparison of the two groups with a=.05. g. Now combine the observation from the tables mentioned in parts (a) and (d). so that are 18 observations for each Treatment. What is the s for treatment 1 and treatment 2? What is M?
f. Conduct a two-tailed comparison of the two groups with a=.05. g. Now combine the observation from the tables mentioned in parts (a) and (d). so that are 18 observations for each Treatment. What is the s for treatment 1 and treatment 2? What is M?

Glencoe Algebra 1, Student Edition, 9780079039897, 0079039898, 2018
18th Edition
ISBN:9780079039897
Author:Carter
Publisher:Carter
Chapter10: Statistics
Section10.4: Distributions Of Data
Problem 19PFA

Related questions
Question
Looking for a detailed answer to the sub parts g and f please. Thanks.
Transcribed Image Text:graph
Styles
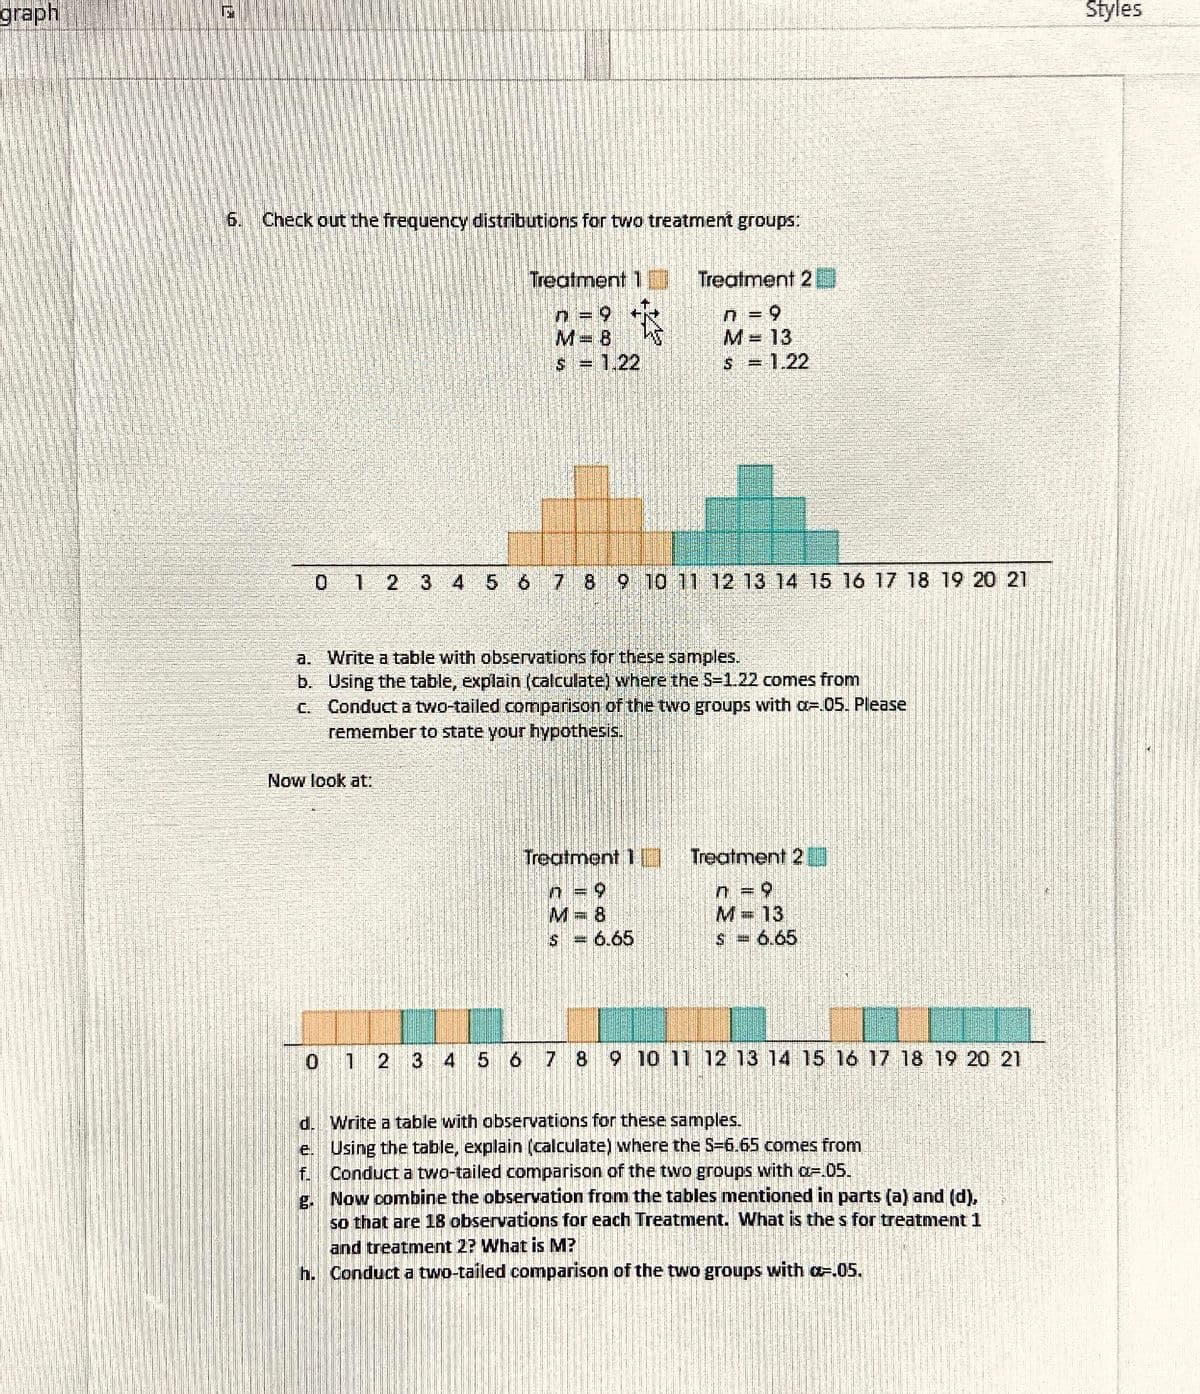
6. Check out the frequency distributions for two treatment groups:
Treatment 1I
Treatment 2
n = 9
M= 8
n = 9
M= 13
S = 1.22
S = 1.22
0 1 2 3 4 5 6
7 8
9 10 11 12 13 14 15 16 17 18 19 20 21
a. Write a table with observations for these samples.
b. Using the table, explain (calculate) where the S=1.22 comes from
C. Conduct a two-tailed comparison of the two groups with a=.05. Please
remember to state your hypothesis.
Now look at:
Treatment 1I
Treatment 2 O
n = 9
M= 8
S = 6.65
n = 9
M= 13
S = 6.65
2
3
5 6
7 8
9 10 11 12 13 14 15 l6 17 18 19 20 21
d. Write a table with observations for these samples.
e. Using the table, explain (calculate) where the S=6.65 comes from
Conduct a two-tailed comparison of the two groups with a=.05.
f.
g. Now combine the observation from the tables mentioned in parts (a) and (d),
so that are 18 observations for each Treatment. What is the s for treatment 1
and treatment 2? What is M?
h. Conduct a two-tailed comparison of the two groups with a-.05.
Expert Solution
Step 1
f. For the two-tailed comparison for two groups, the null and alternative hypothesis are given by :
The test statistics is given by Students' t-distribution because population standard deviation is unknown.
The two-tailed critical value for t-distribution at with degrees of freedom is
The null hypothesis is rejected according to the decision rule when calculated test statistics is greater than the tabulated value and is accepted otherwise.
Since , null hypothesis is accepted concluding that the average for the two groups are same.

Step by step
Solved in 2 steps

Knowledge Booster


Learn more about
Need a deep-dive on the concept behind this application? Look no further. Learn more about this topic, statistics and related others by exploring similar questions and additional content below.Recommended textbooks for you
Glencoe Algebra 1, Student Edition, 9780079039897…
Algebra
ISBN:
9780079039897
Author:
Carter
Publisher:
McGraw Hill
Glencoe Algebra 1, Student Edition, 9780079039897…
Algebra
ISBN:
9780079039897
Author:
Carter
Publisher:
McGraw Hill