9. The following gives data for the age of a car and its dollar value 3500 9950 8950 13500 (a) Test using α = 0.05 to see if there is a correlation between these two variables (b) Find the equation of the regression line (c) Make a prediction for the value of the car after 6 years. 75 37 03 12 121sI


Correlation
Correlation defines a relationship between two independent variables. It tells the degree to which variables move in relation to each other. When two sets of data are related to each other, there is a correlation between them.
Linear Correlation
A correlation is used to determine the relationships between numerical and categorical variables. In other words, it is an indicator of how things are connected to one another. The correlation analysis is the study of how variables are related.
Regression Analysis
Regression analysis is a statistical method in which it estimates the relationship between a dependent variable and one or more independent variable. In simple terms dependent variable is called as outcome variable and independent variable is called as predictors. Regression analysis is one of the methods to find the trends in data. The independent variable used in Regression analysis is named Predictor variable. It offers data of an associated dependent variable regarding a particular outcome.
The following gives data for the age of car and its dollar value:
a) Test using a + 0.05 to see if there is a
b)Find the equation of the regression line
c)Make a prediction for the value of the car after 6 years.

A data of age of car and its dollar value is given.
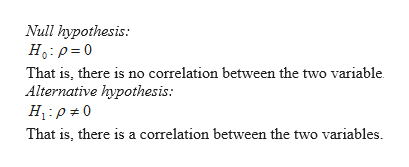
For checking the correlation between the two variables, we have to use the below hypothesis.
Let ρ be the true correlation coefficient.
Sample correlation:
The sample correlation can be found by the Excel formula, “=CORREL(A1:A6,B1:B6)” by entering in column A and B, the age of the car and dollar value were entered.
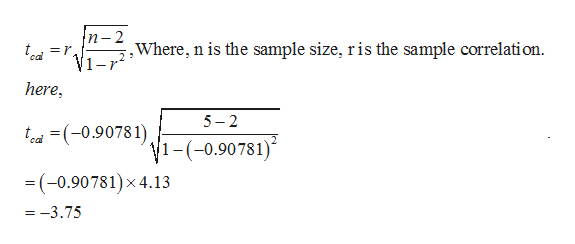
The correlation is r = -0.90781.
Test statistics:
The test statistic is given by,
Critical value:
The level of significance .
The degrees of freedom is, n-2 = 3
Using the Excel formula, “=T.INV.2T(0.05,3)”, the critical value is ±3.18.
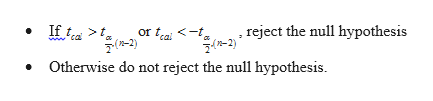
Decision rule:
Conclusion:
Here, the test statistic is less than the critical value, that is, -3.75<-3.18.
Therefore, by the rejection rule, the null hypothesis is rejected.
Hence, there is proper evidence to conclude that there is a correlation between the age of the car and its dollar at 5% level of significance.
b.
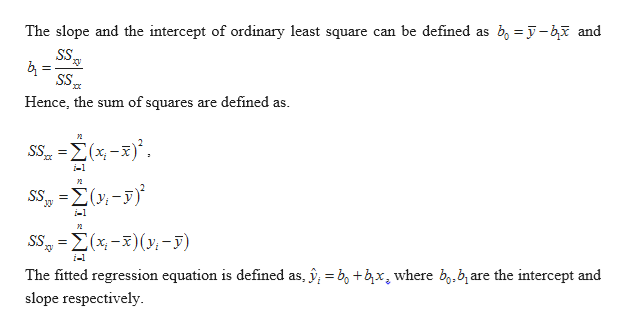
Regression:
Suppose x1, x2, …xn be n sample values of independent variable and the corresponding dependent variable values are y1, y2, …yn.

Step by step
Solved in 10 steps with 8 images


