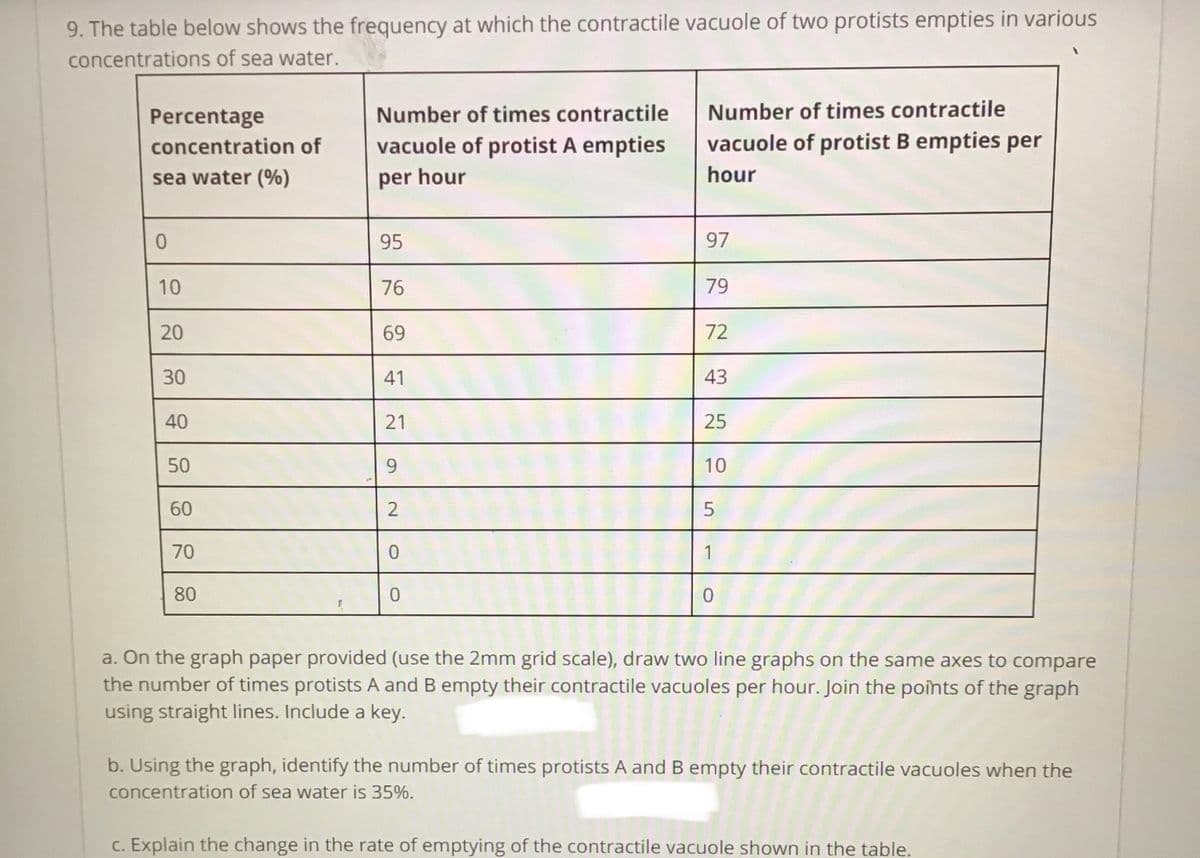
9. The table below shows the frequency at which the contractile vacuole of two protists empties in various concentrations of sea water. Percentage Number of times contractile Number of times contractile concentration of vacuole of protist A empties vacuole of protist B empties per sea water (%) per hour hour 95 97 10 76 79 20 69 72 30 41 43 40 21 25 50 9. 10 60 70 1 80 0. a. On the graph paper provided (use the 2mm grid scale), draw two line graphs on the same axes to compare the number of times protists A and B empty their contractile vacuoles per hour. Join the points of the graph using straight lines. Include a key. b. Using the graph, identify the number of times protists A and B empty their contractile vacuoles when the concentration of sea water is 35%. C. Explain the change in the rate of emptying of the contractile yacuole shown in the tahle


Percentage
A percentage is a number indicated as a fraction of 100. It is a dimensionless number often expressed using the symbol %.
Algebraic Expressions
In mathematics, an algebraic expression consists of constant(s), variable(s), and mathematical operators. It is made up of terms.
Numbers
Numbers are some measures used for counting. They can be compared one with another to know its position in the number line and determine which one is greater or lesser than the other.
Subtraction
Before we begin to understand the subtraction of algebraic expressions, we need to list out a few things that form the basis of algebra.
Addition
Before we begin to understand the addition of algebraic expressions, we need to list out a few things that form the basis of algebra.
PLEASE USE A GRAPH PAPER AND FOR 10 MINS PLEAEE AS SEOON AS YOU CAN

Step by step
Solved in 4 steps with 2 images


