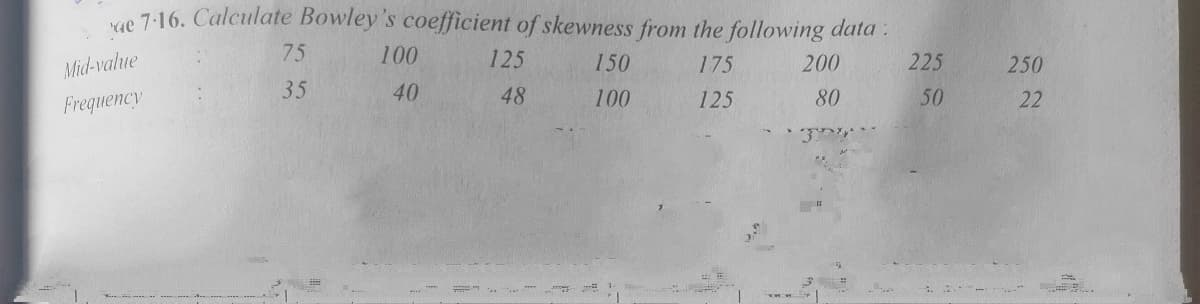
ve 7:16. Calculate Bowley's coefficient of skewness from the following data: 75 100 125 150 175 200 225 250 Mid-value 35 40 48 100 125 80 50 22 Frequency


Q: For the given data calculate Skewness by Karl Pearson’s method Weight in kg 118-126 127-135 136-144…
A: Given Information: Class limit True limit Mid point x f(x) x.f(x) x-x¯2 f(x)×x-x¯2 Cumulative…
Q: What is the relationship between Za and Zb? A E a В
A: Vertical angles: the angles should be formed by two intersecting lines and both should be opposite.…
Q: The data show the chest se and wigf severbean Fed e ngrsion eqution ting chest se be he ndepandent…
A: Create a table with column labels x, y, xy, x2, and y2 . x y xy x2 y2 58 425 24650 3364 180625…
Q: The two data sets are dependent. Find d to the nearest tenth. X21 6872 55 68 57 Y 90 787A193 O 20 O…
A: The sample size n is 6.
Q: The two data sets are dependent. Find d to the near est tenth. X 6.5 8.9 7.5 8.1 6.8 5.7 7) Y 9.1…
A: Solution: 7. From the given information, the data set is
Q: The following sample is collected as a conclusion of an observation: |2 3 47.3 66.7 4 6. 7 9 10 |Y…
A: The following equation is given in the question Now, Enter this data into Excel Taking log of Y…
Q: Q - 16 From the following data compute Bowley's coefficient of skewness and interpret your result.…
A:
Q: Based on the data below, calculate the regression line(each value to at least two decimal places) X…
A:
Q: Q2) Given the data points (0,7), (2,11), (3,28) use Lagrange's method to determine У(1).
A:
Q: Below is the distance (X) of lightning flash versus charge (Y) transferred to earth X 6 6 6 6…
A: For the provided data, the value of correlation coefficient can be calculated as;
Q: The coefficient of correlation between X and Y is and of = a, ož = 4a, and o; = 114 where Z = 3X –…
A: Given that Z=3X-4YSo,…
Q: A study of the relationship between age and various visual functions (such as acuity and depth…
A: Given data…
Q: Find the curve of best fit of the type y = a = ae" - aeox to the following data by the method of…
A:
Q: 5. Fit the following data in a linearly regressed line. Find the co-efficient of variation. x, cm 2…
A:
Q: 7. Calculate Bowley's coefficient of skewnëss for the data given below : Weight (in lbs.) Below 100…
A: To find Bowley's coefficient of skewness, we first need to calculate three quartiles at…
Q: 8 F. b| 13 ョ|^,黑, I Normal T Aa A AaBbCcI AaBbCcI AABBCCD AaB AaBbCcI I No Spac... Heading 2…
A: As given in the test, we need to find if, the elderly people who own pets are equally likely to…
Q: The following data was taken from experiment. The data can be modeled by the following equation. ya…
A: From the given information, the given model is,…
Q: Consider the following data. 21 6. 12 30 55 10.5 20.4 31.3 38.6 75.9 118.8 (a) Find a linear model.…
A: Given that the data are x 2 5 9 12 30 55 y 10.5 20.4 31.3 38.6 75.9…
Q: Calculate Pearson's coefficient of skewness from the following data: X f f 12.5 28 32.5 129 17.5 42…
A: Given data is X F 12.5 28 17.5 42 22.5 54 27.5 108 32.5 129 37.5 61 42.5 45 47.5…
Q: From the data given below, calculate Karl Pearson's and Bowley's coefficients of skewness. Mean 150,…
A: Notation M=mean, Mo=Mode and Md=median , SD=Standard deviation
Q: Calculate C.I, Sample Skewness and Sample Kurtosis from the following grouped data: Class 5-15 15-25…
A:
Q: From the following data of age of employees, calculate Karl Pearson's coefficient of skewness and…
A: Given data: age below (yrs) no. of employees 25 8 30 20 35 40 40 65 45 80 50 92 55…
Q: Q2/ The speed ,v meters per second ,of a car ,t seconds after it starts ,is shown in table 12 24 36…
A:
Q: The data below are the temperatures on randomly chosen days during a summer class and the number of…
A:
Q: For Exercise, use the given data to find a variation model relating y to x. HORHAL FLORT RUTO bl…
A:
Q: 376 an38. From the following data calculate Karl Pearson's coefficient of skewness: 80 Maks more…
A:
Q: Calculate Karl Pearson's coefficient of skewness from the following data : Weight (lbs.) No. of…
A:
Q: 1. The following data table is obtained by a fourth grader on his science project, "Exploding Foam."…
A: Let X be the temperature in o F and Y be the volume ml n = number of observations = 19
Q: Calculate Karl Pearson's co-efficient of skewness from the following data: Size 2 3 4. 5 6.…
A: X Frequency 1 10 2 18 3 30 4 25 5 12 6 3 7 2
Q: Q2: From the table data below , find (Two ) of the following :- C 2-6 7- 11 12-16 17 - 21 22- 26 F…
A: Introduction- Mid point=Lowerclass limit +upper class limit 2 median =L+N2-Cffhwhere , L=Lower…
Q: Given the following data: -1 1 2 y -1 1 Predict the value of y(1.5) using natural cubic spline…
A: Cubic spline formula is fi(x)=xi-x36hMi-1+x-xi-136hMi+xi-xhyi-1-h26Mi-1+x-xi-1hyi-h26Mi........(1)…
Q: Consider the following Al ible. Source S d.f. MS V.R. 2.824 115.7527 14.0714 Treatments 231.5054…
A: a) From the given output, The design was two way ANOVA, since the source of variation is given by…
Q: 6. Calculate Bowley's Coefficient of Skewness from the following data : Marks No. of students Marks…
A: Answer: Using the given data,
Q: The following data is given: x 0 2 3 5 6 y 1 1 7 11 20 Question 1 Determine the best (according to…
A: Given data, X Y X*Y X*X 0 1 0 0 2 1 2 4 3 7 21 9 5 11 55 25 6 20 120 36
Q: Complete the given table with the values of the 3-unit moving average of the given function. 1 2 3 4…
A: To calculate the 3-unit moving average, follow these steps: 1. Add up the first 3 numbers in the…
Q: For the samples r(tk) = 4,2,6, –1, plot the "sinc" interpolation function. In your %3D opinion, does…
A: The basis function used in 'sinc' interpolation is : sinc(t) = sin(πt)/(πt) when t≠0 and 1 when…
Q: Calculate Karl Pearson's Co-efficient of skewness from the following data Number of Students Marks…
A:
Q: Q2: From the table data below , find (Two ) of the following :- 7-11 43 17- 21 22-26 12 - 16 65 2-6…
A:
Q: Complete the given table with the values of the 3-unit moving average of the given function. 0 1 3 4…
A: Here from the given table we want to find the 3 year moving average.
Q: - "fie7. Calculate the coefficient of skewness fro.he following data: 50-60 Marks 10-20 20-30 30-40…
A: Solution-: We prepare the following table: From this table we get, We first find, and Mode then
Q: J 49+14
A:
Q: From the following data calculate Karl Pearson's coefficient of skewness : 40 80 60 30 70 14 80…
A:
Q: Given the following information, describe the variation. 3 7 10 y 2 8 20 29 A Direct Variation…
A: Direct variation describes a simple relationship between two variables . We say y varies directly…
Q: Listed below are the overhead widths (cm) of seals measured from photographs and the weights (kg) of…
A: Extrapolation:If anyone wants to estimate a value of the dependent variable for a value of…
Q: Base your answer to the following questions on the Punnett square, which shows a cross between two…
A:
Q: Calculate the Karl Pearson's coefficient of skewness from owing data : Size : 1 2 3 4 5 7 Frequency…
A: Given: Size Frequency 1 10 2 18 3 30 4 25 5 12 6 3 7 2
Q: From the information given below calculate Karl Pearson's coefficient of skewness. Measure Place A…
A:
Q: The following data is given: x02 3 5 6 y|1 1 7 11 20 Question 1 Determine the best (according to…
A:
Q: 4. Calculate Karl Pearson's Coefficient of Skewness from the following data Marks 0-10 10-20 20-30…
A:
Q: a) Consider the following data: x12 3 4 y 345 6 Briefly explain why it can be seen from this data…
A: We need to find a constant for which x = ay If there is not unique a then these are not…

Step by step
Solved in 2 steps with 2 images

- The data given is shown below 40 40 43 46 44 49 51 54 46 51 47 49 49 45 45 44 45 41 49 52 51 54 50 51 41 52 53 50 46 56 42 42 40 42 49 47 51 48 46 57 48 55 49 46 57 44 49 43 44 43 51 48 48 46 49 Class width = 6 Find the following: A. Decile (5th) B. Quartile (2nd) C. Skewness D. KurtosisThe results of an independent-measures research study are reported as "t(20) = 2.12, p < .05, two tails." For this study, what t values formed the boundaries for the critical region?You obtained the following raw data when setting up a Biuret standard curve: BSA (mg/ml) Absorbancy 540nm 0 0.158 1 0.210 2 0.260 3 0.305 4 0.360 5 0.410 6 0.455 7 0.510 8 0.530 9 0.550 10 0.554 What would the quality of the line-fit (R2 value) be if you do not exclude experimental outliers? (Give you answer to 4 decimal places)
- The betas are chosen so as to minimize: a. Errors b. SSR c. PMP d. Bias e. NoiseAn analysis of production rejects resulted in the following figures: (attached) Calculate Karl Pearson’s coefficient of skewness and comment on the results.For this grouped data set: Scores | Frequencies 30-34 | 7 25-29 | 9 20-24 | 14 15-19 | 10 10-14 | 8 5-9 | 2 What is the Skewness and Kurtosis of the data set?
- Given the Data:Test the hypothesis that p(rho)xy is not equal to 0 at the 0.05 level of significance.Two samples of sizes 60 and 90 have 52 and 48 as the respective A.Ms. and 9 and 12 as the respective S.Ds. Find the A.M and S.D. of the combined sample of size 150.Q1 A) List down the measures of central tendency and measures of dispersion 2) The operations manager of a plant that manufactures tires wants to compare the actual inner diameters of two grades of tires, each of B) which is expected to be 575 millimeters. A sample of five tires of each grade was selected, and the results representing the inner diameters of the tires, ranked from smallest to largest, are as follows. Grade X grade Y 568 570 575 578 584 573 574 575 577 578 requirement. a) for each of the tow grades of tries, compute the mwan, median, and standred deviation. b) which grade of tire providing better quality? explain. c) what would be the effect on your answer in (a) and (b) if the last value for grade Y were 588 insert 578 explain. C) The file contins the overall miles per gallon (MPG) OF 2010 family sedan: 24 21 22 23 24 34 34 34 20 20 22 22 44 32 20 20 22 20 39 20 Source:…
- If X is b(100,0.1), how do you find the value of P(12 < X < 14) using the normal approximation and the Poisson approximationThe variance of the event of a coin being thrown four times equal to the center of gravity is the following? Please select one: a. 2.0 b. 0.5 c. 1.5 d. 1.0 e. IncalculableFor the given data calculate Skewness by Karl Pearson’s method Weight in kg 118-126 127-135 136-144 145-153 154-162 Number of items 2 6 10 4 3

