9.15 On the basis of past data, the owner of an automobile dealership finds that, on average, 8.5 cars are sold per day on Saturdays and Sundays during the months of January and February, with the sales rate relatively stable throughout the day. Moreover, purchases appear to be independent of one another. The dealership is open for 10 hours per day on each of these days. There is no reason to believe that the sales for the upcoming year will be any different from in the past. a On the first Saturday in February, the dealership will open at 9 A.M. Find the proba- bility that the time until the first sale is more than two hours, PE(722 hours | m = 8.5 cars per 10 hours). b Find the probability that the number of sales before 11 A,M. is equal to zero. Pp(X =0 in 2 hours | m =8.5 cars per 10 hours). Compare your answer with that from part a. Can you explain why the answers are the same?
9.15 On the basis of past data, the owner of an automobile dealership finds that, on average, 8.5 cars are sold per day on Saturdays and Sundays during the months of January and February, with the sales rate relatively stable throughout the day. Moreover, purchases appear to be independent of one another. The dealership is open for 10 hours per day on each of these days. There is no reason to believe that the sales for the upcoming year will be any different from in the past. a On the first Saturday in February, the dealership will open at 9 A.M. Find the proba- bility that the time until the first sale is more than two hours, PE(722 hours | m = 8.5 cars per 10 hours). b Find the probability that the number of sales before 11 A,M. is equal to zero. Pp(X =0 in 2 hours | m =8.5 cars per 10 hours). Compare your answer with that from part a. Can you explain why the answers are the same?

Glencoe Algebra 1, Student Edition, 9780079039897, 0079039898, 2018
18th Edition
ISBN:9780079039897
Author:Carter
Publisher:Carter
Chapter10: Statistics
Section10.1: Measures Of Center
Problem 9PPS

Related questions
Question
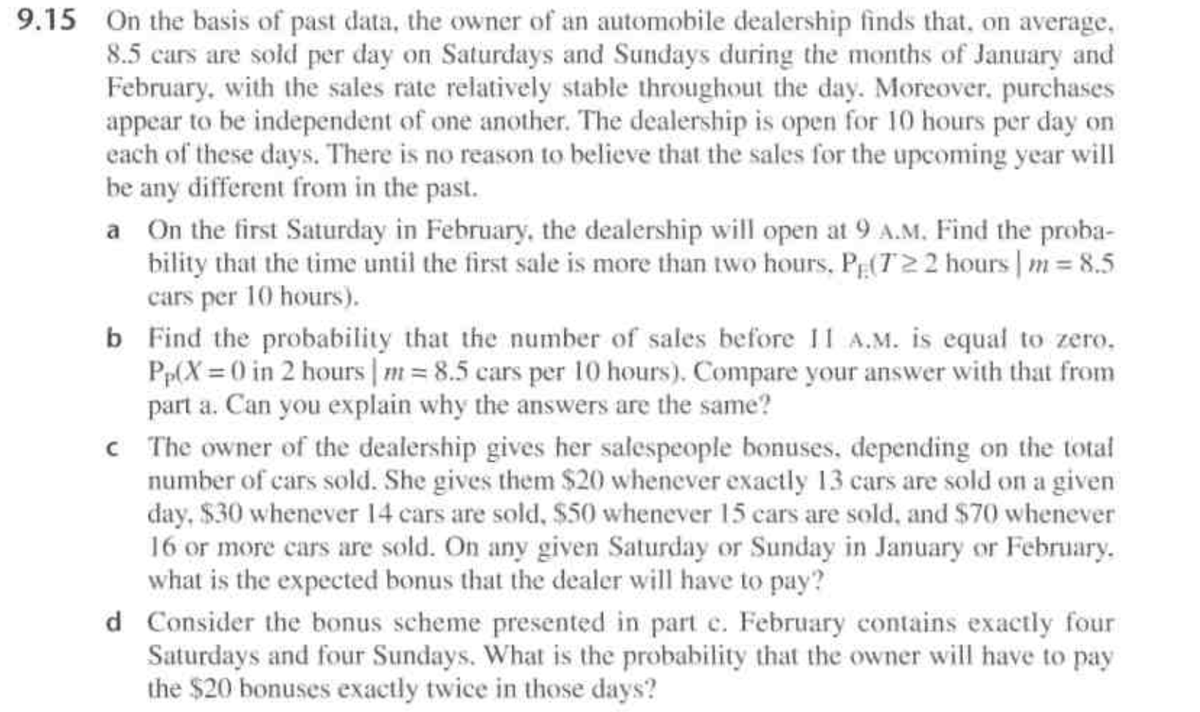
Transcribed Image Text:9.15 On the basis of past data, the owner of an automobile dealership finds that, on average,
8.5 cars are sold per day on Saturdays and Sundays during the months of January and
February, with the sales rate relatively stable throughout the day. Moreover, purchases
appear to be independent of one another. The dealership is open for 10 hours per day on
each of these days. There is no reason to believe that the sales for the upcoming year will
be any different from in the past.
a On the first Saturday in February, the dealership will open at 9 A.M, Find the proba-
bility that the time until the first sale is more than two hours, PE(T22 hours | m = 8.5
cars per 10 hours).
b Find the probability that the number of sales before 11 A.M. is equal to zero.
Pp(X 0 in 2 hours m 8.5 cars per 10 hours). Compare your answer with that from
part a. Can you explain why the answers are the same?
C The owner of the dealership gives her salespeople bonuses, depending on the total
number of cars sold. She gives them $20 whenever exactly 13 cars are sold on a given
day, $30 whenever 14 cars are sold, $50 whenever 15 cars are sold, and $70 whenever
16 or more cars are sold. On any given Saturday or Sunday in January or February.
what is the expected bonus that the dealer will have to pay?
d Consider the bonus scheme presented in part e. February contains exactly four
Saturdays and four Sundays. What is the probability that the owner will have to pay
the $20 bonuses exactly twice in those days?
Expert Solution
This question has been solved!
Explore an expertly crafted, step-by-step solution for a thorough understanding of key concepts.

This is a popular solution!

Trending now
This is a popular solution!

Step by step
Solved in 3 steps with 3 images

Recommended textbooks for you
Glencoe Algebra 1, Student Edition, 9780079039897…
Algebra
ISBN:
9780079039897
Author:
Carter
Publisher:
McGraw Hill
Glencoe Algebra 1, Student Edition, 9780079039897…
Algebra
ISBN:
9780079039897
Author:
Carter
Publisher:
McGraw Hill