1,000 students at college level are graded according to their 1.Q. and their economic conditions. Use chi-square test to find out whether there is any association between economic conditions and the level of 1.Q. Voupenert Economic Condition I.Q High Medium Low Total Rich 160 300 140 600 Poor 140 100 160 400 Total 300 400 300 1,000
1,000 students at college level are graded according to their 1.Q. and their economic conditions. Use chi-square test to find out whether there is any association between economic conditions and the level of 1.Q. Voupenert Economic Condition I.Q High Medium Low Total Rich 160 300 140 600 Poor 140 100 160 400 Total 300 400 300 1,000

MATLAB: An Introduction with Applications
6th Edition
ISBN:9781119256830
Author:Amos Gilat
Publisher:Amos Gilat
Chapter1: Starting With Matlab
Section: Chapter Questions
Problem 1P

Related questions
Question
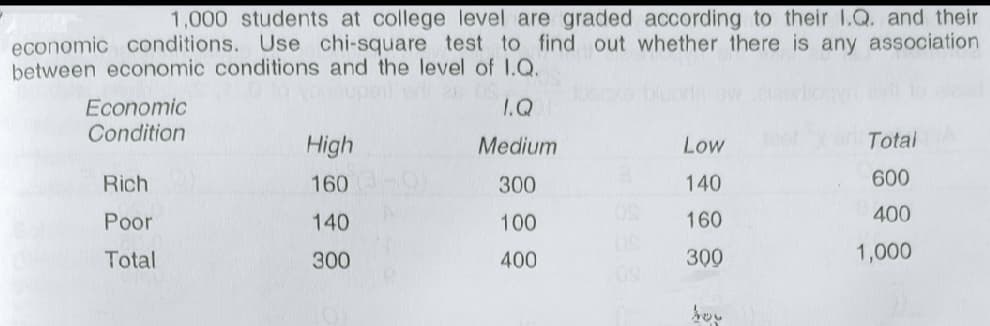
Transcribed Image Text:1,000 students at college level are graded according to their 1.Q. and their
economic conditions. Use chi-square test to find out whether there is any association
between economic conditions and the level of 1.Q.
bluorts ow
Economic
1.Q
Condition
High
Medium
Total
Low
Rich
160
300
140
600
Poor
140
100
160
400
Total
300
400
300
1,000
Expert Solution
This question has been solved!
Explore an expertly crafted, step-by-step solution for a thorough understanding of key concepts.

Step by step
Solved in 4 steps with 4 images

Recommended textbooks for you
MATLAB: An Introduction with Applications
Statistics
ISBN:
9781119256830
Author:
Amos Gilat
Publisher:
John Wiley & Sons Inc

Probability and Statistics for Engineering and th…
Statistics
ISBN:
9781305251809
Author:
Jay L. Devore
Publisher:
Cengage Learning

Statistics for The Behavioral Sciences (MindTap C…
Statistics
ISBN:
9781305504912
Author:
Frederick J Gravetter, Larry B. Wallnau
Publisher:
Cengage Learning
MATLAB: An Introduction with Applications
Statistics
ISBN:
9781119256830
Author:
Amos Gilat
Publisher:
John Wiley & Sons Inc
Probability and Statistics for Engineering and th…
Statistics
ISBN:
9781305251809
Author:
Jay L. Devore
Publisher:
Cengage Learning
Statistics for The Behavioral Sciences (MindTap C…
Statistics
ISBN:
9781305504912
Author:
Frederick J Gravetter, Larry B. Wallnau
Publisher:
Cengage Learning

Elementary Statistics: Picturing the World (7th E…
Statistics
ISBN:
9780134683416
Author:
Ron Larson, Betsy Farber
Publisher:
PEARSON

The Basic Practice of Statistics
Statistics
ISBN:
9781319042578
Author:
David S. Moore, William I. Notz, Michael A. Fligner
Publisher:
W. H. Freeman

Introduction to the Practice of Statistics
Statistics
ISBN:
9781319013387
Author:
David S. Moore, George P. McCabe, Bruce A. Craig
Publisher:
W. H. Freeman