A-1 complete the table under the current cost system. A-2 determine which products, if any, should be dropped. C-1 Assume that CBI drops the product(s) identified in requirement (a) above. Calculate the gross profit margin percentage for the remaining products. Assume that CBI can sell all products that it manufactures and that it will use the excess capacity from dropping a product to produce more of the most profitable product.
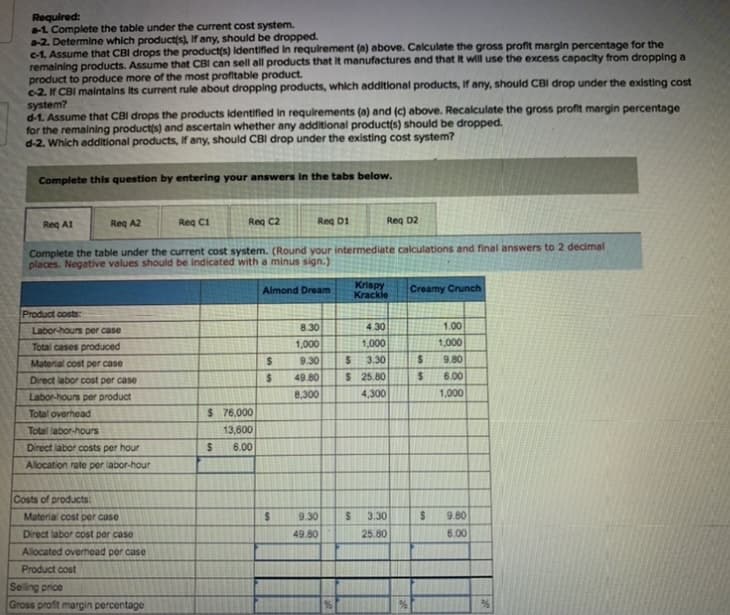
Q: Fill in the missing amounts in each of the eight case situations below. Each case is independent of…
A: Cost volume profit analysis: Cost volume profit analysis measures the effect on income of a company…
Q: Falsetta Corporation makes three products that use the current constraint, which is a particular…
A: The most profitability of the three products that the Falsetta Corporation can be computed by…
Q: Olson Corporation, a retailer and wholesaler of national brand-name household lighting fixtures,…
A:
Q: Product Tango has revenue of $195,700, variable cost of goods sold of $115,400, variable selling…
A: Cost incurred in both the alternatives will be calculated and compared.
Q: Scarce resource; discontinued product lines; negative contribution margin The officers of Bardwell…
A: Since we only answer up to 3 sub-parts, we’ll answer the first 3. Please resubmit the question and…
Q: Cesar Company has three product lines: A, B and C. The information given below is available. Assume…
A: Operating income means the revenue that is made by the business after deducting the expenses related…
Q: 1. Determine the amount of desired profit from the production and sale of flat panel displays. 2.…
A: Since you have posted a question with multiple sub-parts, we will solve first three sub-parts for…
Q: Wholesaler Retailer Consumer Rial Rial Sales Per Unit 3.60 Estimated Sales per year (units) 1, 00,…
A: (a) Decision regarding the preferable distribution channel: The company should change its…
Q: Required: 1. What is the financial advantage (disadvantage) of accepting the special order? 2. As a…
A: This whole question is based on the concept Relevant cost What is Relevant cost? In simple words,…
Q: Differential analysis for a discontinued product The condensed product-line income statement for…
A: Management accounting is a very important technique of determining and analyzing that if there is an…
Q: When deciding whether we should add or drop a product or segment, we should think about Multiple…
A: When deciding whether we should add or drop a product or segment, we should think about : the…
Q: Effects of differing production levels on absorption costing income: Metrics to minimize inventory…
A: Absorption costing is the method of coating which charges all the manufacturing cost which may be…
Q: Central Industries has three product lines: A, B, and C. The information given below is available.…
A: Operating income is the amount of revenue realized from the operations of the business, after…
Q: Company XYZ sells two products: AAA and BBB. Product BBB has a lower selling price but higher…
A: Following is the solution to given problem
Q: Missing Data: Basic CVP Concepts Fill in the missing amounts in each of the eight case situations…
A:
Q: Product Tango has revenue of $194,600, variable cost of goods sold of $114,200, variable selling…
A: a. Differential Analysis Continue Product Tango (Alt. 1) or Discontinue Product Tango (Alt. 2)…
Q: A company has assessed the profitability of its three products as shown here: Product A Product B…
A: In the given question, product C is a loss-making product. Currently, the company is earning a loss…
Q: Discontinue a Segment Product A has revenue of $195,700, variable cost of goods sold of $114,800,…
A: Calculate the differential effect on income.
Q: Match the following terms with the correct definitions: 1. Costs that do not change in total over…
A: Cost accounting is a form of managerial accounting used to assess the cost of production and various…
Q: 1. Due to change in market conditions a company finds that it can sell as many of each of its three…
A: Hey, since there are multiple questions posted, we will answer first question. If you want any…
Q: Required: 1. Determine the total relevant cost per unit if starters are made inside the company.…
A:
Q: Required: 1. What is the overall contribution margin (CM) ratio for the company? 2. What is the…
A: Contribution margin (CM) or gross profit refers to the profit earns by the company for selling goods…
Q: Using terminology Match the following terms with the correct definitions:
A: Costs that do not change in total over wide ranges of volume - Fixed Cost Technique that estimates…
Q: Product X has revenue of $94,800, variable cost of goods sold of $61,200, variable selling expenses…
A: Formula: Profit or ( loss ) = Revenues - costs Deduction of costs from revenues derives the Profit (…
Q: Product AG52 has revenues of $195,200, variable cost of goods sold of $113,000, variable selling…
A: a. Differential Analysis Continue Product AG52 (Alt. 1) or Discontinue Product AG52 (Alt. 2)…
Q: G) Sales Mix Analysis. The C.E.O. then indicates his concern as to which products should be sold to…
A: The question is related to Marginal Costing. The Contribution Margin is the difference between the…
Q: Required: 1. Compute the company's break-even point in unit sales. 2. Assume the company uses…
A: A variable costing income statement is one in which all variable expenses are deducted from revenue…
Q: Variable and Absorption Costing-Three Products Winslow Inc. manufactures and sells three types of…
A: Formula to compute the variable cost of goods sold.
Q: Cesar Company has three product lines: A, B and C. The information given below is available. Assume…
A: Operating Income Operating income is described as after deducting the cost of goods sold other…
Q: What type of cost includes product ingredients and materials? a. fixed c. total b. revenue d.…
A: Hi student Since there are multiple questions, we will answer only first question. Cost accounting…
Q: True or False 1. If a company has mixed expenses, the fixed component can be combined with the…
A:
Q: Assume that a company manufactures and sells a variety of products, one of which it refers to as…
A: Formula: Financial advantage (disadvantage) of dropping product A = Total savings - Unavoidable…
Q: The constraint at Corporaion is time on a particular machine. The company makes three products that…
A: Solution:- Ranking the products in order of their current profitability from most profitable to…
Q: Prepare a differential analysis dated February 26 on whether to Sell Product P (Alternative 1) or…
A: Differential analysis is done to make decision-related to the addition of a new production unit and…
Q: A product called Wallaby has revenue of $1,250,000, variable costs of goods sold of $850,000,…
A: If loss making product Wallaby is discontinued then the entire fixed cost will be allocated to other…
Q: Effects of differing production levels on absorption costing income: Metrics to minimize inventory…
A:
Q: Direction: Encircle the letter of the correct answer. 1. What type of cost includes product…
A: Fixed Cost : The cost that doesn't change with a change in the production. Example: Depreciation…
Q: Management's decision and conclusion are incorrect . The profit will not be improved because the…
A: Variable Costing and Absorption Costing Absorption Costing: In this system of costing, both…
Q: Requlred: 1. Complete the following: a. Compute the unit product cost under absorption costing. b.…
A: Requirement 1B: The calculation of net operating income or loss is as follows: The resultant table…
Q: Fixed costs are 35% of the cost of goods sold and 14% of the selling and administrative expenses.…
A: a) Workings: Variable cost of goods sold: Bowls = 255000*(1-35%)=$165750 Plates =…
Trending now
This is a popular solution!
Step by step
Solved in 2 steps with 1 images
- Phillips Inc. produces two distinct products, A and B. The products do not compete with each other in the marketplace; that is, neither cost, price, nor demand for one product will impact the demand for the other. Phillips’ analysts have collected data on the effects of advertising on profits. These data suggest that, although higher advertising correlates with higher profits, the marginal increase in profits diminishes at higher advertising levels, particularly for product B. Analysts have estimated the following functions: where XA and XB are the advertising amount allocated to products A and B, respectively, in thousands of dollars, profit is in millions of dollars, and LN is the natural logarithm function. The advertising budget is $500,000, and management has dictated that at least $50,000 must be allocated to each of the two products. (Hint: To compute a natural logarithm for the value X in Excel, use the formula = LN(X). For Solver to find an answer, you also need to start with decision variable values greater than 0 in this problem.) Build an optimization model that will prescribe how Phillips should allocate its marketing budget to maximize profit. Solve the model you constructed in part (a) using Excel Solver.Morrisons Plastics Division, a profit center, sells its products to external customers as well as to other internal profit centers. Which one of the following circumstances would justify the Plastics Division selling a product internally to another profit center at a price that is below the market-based transfer price? a. The buying unit has excess capacity. b. The selling unit is operating at full capacity. c. Routine sales commissions and collection costs would be avoided. d. The profit centers managers are evaluated on the basis of unit operating income.Danna Wise, president of Tidwell Company, recently returned from a conference on quality and productivity. At the conference, she was told that many American firms have quality costs totaling 20 to 30% of sales. The quality experts at the conference convinced her that a company could increase its profitability by improving quality. However, she was of the opinion that the quality of Tidwell Company was much less than 20%probably more in the 4 to 6% range. However, because the potential for increasing profits was so great if she was wrong, she decided to request a preliminary estimate of the total quality costs currently being incurred. She asked her controller for a summary of quality costs, with the costs classified into four categories: prevention, appraisal, internal failure, or external failure. She also wanted the costs expressed as a percentage of both sales and profits. The controller had his staff assemble the following information from the past year, 20X1: a. Sales revenue, 37,240,000; net income, 4,000,000. b. During the year, customers returned 40,000 units needing repair. Repair cost averages 9 per unit. c. Twelve inspectors are employed, each earning an annual salary of 80,000. The inspectors are involved only with final inspection (product acceptance). d. Total scrap is 200,000 units. Of this total, ninety percent is quality related. The cost of scrap is about 10 per unit. e. Each year, approximately 800,000 units are rejected in final inspection. Of these units, seventy-five percent can be recovered through rework. The cost of rework is 1.80 per I unit. f. A customer cancelled an order that would have increased profits by 600,000. The customers reason for cancellation was poor product performance. g. The company employs 10 full-time employees in its complaint department. Each earns 48,600 a year. h. The company gave sales allowances totaling 180,000 due to substandard products being sent to the customer. i. The company requires all new employees to take its 4-hour quality training program. The estimated annual cost of the program is 120,000. Required: 1. Prepare a simple quality cost report classifying costs by category. 2. Compute the quality cost-sales ratio. Also, compare the total quality costs with total profits. Should Danna be concerned with the level of quality costs? 3. Prepare a pie chart for the quality costs. Discuss the distribution of quality costs among the four categories. Are they properly distributed? Explain. 4. Discuss how the company can improve its overall quality and at the same time reduce total quality costs. 5. By how much will profits increase if quality costs are reduced to 3% of sales?
- Aaron McKinney is a cost accountant for Majik Systems Inc. Martin Dodd, Vice President of Marketing, has asked Aaron to meet with representatives of Majik Systems major competitor to discuss product cost data. Martin indicates that the sharing of these data will enable Majik Systems to determine a fair and equitable price for its products. Would it be ethical for Aaron to attend the meeting and share the relevant cost data? Explain your answer.Kimball Company has developed the following cost formulas: Materialusage:Ym=80X;r=0.95Laborusage(direct):Yl=20X;r=0.96Overheadactivity:Yo=350,000+100X;r=0.75Sellingactivity:Ys=50,000+10X;r=0.93 where X=Directlaborhours The company has a policy of producing on demand and keeps very little, if any, finished goods inventory (thus, units produced equals units sold). Each unit uses one direct labor hour for production. The president of Kimball Company has recently implemented a policy that any special orders will be accepted if they cover the costs that the orders cause. This policy was implemented because Kimballs industry is in a recession and the company is producing well below capacity (and expects to continue doing so for the coming year). The president is willing to accept orders that minimally cover their variable costs so that the company can keep its employees and avoid layoffs. Also, any orders above variable costs will increase overall profitability of the company. Required: 1. Compute the total unit variable cost. Suppose that Kimball has an opportunity to accept an order for 20,000 units at 220 per unit. Should Kimball accept the order? (The order would not displace any of Kimballs regular orders.) 2. Explain the significance of the coefficient of correlation measures for the cost formulas. Did these measures have a bearing on your answer in Requirement 1? Should they have a bearing? Why or why not? 3. Suppose that a multiple regression equation is developed for overhead costs: Y = 100,000 + 100X1 + 5,000X2 + 300X3, where X1 = direct labor hours, X2 = number of setups, and X3 = engineering hours. The coefficient of determination for the equation is 0.94. Assume that the order of 20,000 units requires 12 setups and 600 engineering hours. Given this new information, should the company accept the special order referred to in Requirement 1? Is there any other information about cost behavior that you would like to have? Explain.Kathy Shorts, president of Oliver Company, was concerned with the trend in sales and profitability. The company had been losing customers at an alarming rate. Furthermore, the company was barely breaking even. Investigation revealed that poor quality was at the root of the problem. At the end of 20x5, Kathy decided to begin a quality improvement program. As a first step, she identified the following costs in the accounting records as quality related: Required: 1. Prepare a quality cost report by quality cost category. 2. Calculate the relative distribution percentages for each quality cost category. Comment on the distribution. 3. Using the Taguchi loss function, an average loss per unit is computed to be 15 per unit. What are the hidden costs of external failure? How does this affect the relative distribution? 4. Shortss quality manager decided not to bother with the hidden costs. What do you think was his reasoning? Any efforts to reduce measured external failure costs will also reduce the hidden costs. Do you agree or disagree? Explain.
- The following series of statements or phrases are associated with product life-cycle viewpoints. Identify whether each one is associated with the marketing, production, or customer viewpoint. Where possible, identify the particular characteristic being described. If the statement or phrase fits more than one viewpoint, label it as interactive. Explain the interaction. a. Sales are increasing at an increasing rate. b. The cost of maintaining the product after it is purchased. c. The product is losing market acceptance and sales are beginning to decrease. d. A design is chosen to minimize post-purchase costs. e. Ninety percent or more of the costs are committed during the development stage. f. The length of time that the product serves the needs of a customer. g. All the costs associated with a product for its entire life cycle. h. The time in which a product generates revenue for a company. i. Profits tend to reach peak levels during this stage. j. Customers have the lowest price sensitivity during this stage. k. Describes the general sales pattern of a product as it passes through distinct life-cycle stages. l. The concern is with product performance and price. m. Actions taken so that life-cycle profits are maximized. n. Emphasizes internal activities that are needed to develop, produce, market, and service products.In 20X1, Don Blackburn, president of Price Electronics, received a report indicating that quality costs were 31% of sales. Faced with increasing pressures from imported goods. Don resolved to take measures to improve the overall quality of the companys products. After hiring a consultant in 20X1, the company began an aggressive program of total quality control. At the end of 20X5, Don requested an analysis of the progress the company had made in reducing and controlling quality costs. The accounting department assembled the following data: Required: 1. Compute the quality costs as a percentage of sales by category and in total for each year. 2. Prepare a multiple-year trend graph for quality costs, both by total costs and by category. Using the graph, assess the progress made in reducing and controlling quality costs. Does the graph provide evidence that quality has improved? Explain. 3. Using the 20X1 quality cost relationships (assume all costs are variable), calculate the quality costs that would have prevailed in 20X4. By how much did profits increase in 20X4 because of the quality improvement program? Repeat for 20X5.Wayne Johnson, president of Banshee Company, recently returned from a conference on quality and productivity. At the conference, he was told that many American firms have quality costs totaling 20 to 30 percent of sales. He, however, was skeptical about this statistic. But even if the quality gurus were right, he was sure that his companys quality costs were much lowerprobably less than 5 percent. On the other hand, if he was wrong, he would be passing up an opportunity to improve profits significantly and simultaneously strengthen his competitive position. The possibility was at least worth exploring. He knew that his company produced most of the information needed for quality cost reportingbut there never was a need to bother with any formal quality data gathering and analysis. This conference, however, had convinced him that a firms profitability can increase significantly by improving qualityprovided the potential for improvement exists. Thus, before committing the company to a quality improvement program, Wayne requested a preliminary estimate of the total quality costs currently being incurred. He also indicated that the costs should be classified into four categories: prevention, appraisal, internal failure, or external failure. He has asked you to prepare a summary of quality costs and to compare the total costs to sales and profits. To assist you in this task, the following information has been prepared from the past year, 20x5: a. Sales revenue, 15,000,000; net income, 1,500,000. b. During the year, customers returned 90,000 units needing repair. Repair cost averages 1 per unit. c. Four inspectors are employed, each earning an annual salary of 60,000. These four inspectors are involved only with final inspection (product acceptance). d. Total scrap is 150,000 units. Of this total, 60 percent is quality related. The cost of scrap is about 5 per unit. e. Each year, approximately 450,000 units are rejected in final inspection. Of these units, 80 percent can be recovered through rework. The cost of rework is 0.75 per unit. f. A customer cancelled an order that would have increased profits by 150,000. The customers reason for cancellation was poor product performance. g. The company employs three full-time employees in its complaint department. Each earns 40,500 a year. h. The company gave sales allowances totaling 45,000 due to substandard products being sent to the customer. i. The company requires all new employees to take its three-hour quality training program. The estimated annual cost of the program is 30,000. Required: 1. Prepare a simple quality cost report classifying costs by category. 2. Compute the quality cost-to-sales ratio. Also, compare the total quality costs with total profits. Should Wayne be concerned with the level of quality costs? 3. Prepare a pie chart for the quality costs. Discuss the distribution of quality costs among the four categories. Are they properly distributed? Explain. 4. Discuss how the company can improve its overall quality and at the same time reduce total quality costs. 5. By how much will profits increase if quality costs are reduced to 2.5 percent of sales?
- Continuous improvement is the governing principle of a lean accounting system. Following are several performance measures. Some of these measures would be associated with a traditional standard-costing accounting system, and some would be associated with a lean accounting system. a. Materials price variances b. Cycle time c. Comparison of actual product costs with target costs d. Materials quantity or efficiency variances e. Comparison of actual product costs over time (trend reports) f. Comparison of actual overhead costs, item by item, with the corresponding budgeted costs g. Comparison of product costs with competitors product costs h. Percentage of on-time deliveries i. First-time through j. Reports of value- and non-value-added costs k. Labor efficiency variances l. Days of inventory m. Downtime n. Manufacturing cycle efficiency (MCE) o. Unused (available) capacity variance p. Labor rate variance q. Using a sister plants best practices as a performance standard Required: 1. Classify each measure as lean or traditional (standard costing). If traditional, discuss the measures limitations for a lean environment. If it is a lean measure, describe how the measure supports the objectives of lean manufacturing. 2. Classify the measures into operational (nonfinancial) and financial categories. Explain why operational measures are better for control at the shop level (production floor) than financial measures. Should any financial measures be used at the operational level? 3. Suggest some additional measures that you would like to see added to the list that would be supportive of lean objectives.Auflegger, Inc., manufactures a product that experiences the following activities (and times): Required: 1. Compute the MCE for this product. 2. A study lists the following root causes of the inefficiencies: poor quality components from suppliers, lack of skilled workers, and plant layout. Suggest a possible cost reduction strategy, expressed as a series of if-then statements that will reduce MCE and lower costs. Finally, prepare a strategy map that illustrates the causal paths. In preparing the map, use only three perspectives: learning and growth, process, and financial. 3. Is MCE a lag or a lead measure? If and when MCE acts as a lag measure, what lead measures would affect it?At the beginning of the last quarter of 20x1, Youngston, Inc., a consumer products firm, hired Maria Carrillo to take over one of its divisions. The division manufactured small home appliances and was struggling to survive in a very competitive market. Maria immediately requested a projected income statement for 20x1. In response, the controller provided the following statement: After some investigation, Maria soon realized that the products being produced had a serious problem with quality. She once again requested a special study by the controllers office to supply a report on the level of quality costs. By the middle of November, Maria received the following report from the controller: Maria was surprised at the level of quality costs. They represented 30 percent of sales, which was certainly excessive. She knew that the division had to produce high-quality products to survive. The number of defective units produced needed to be reduced dramatically. Thus, Maria decided to pursue a quality-driven turnaround strategy. Revenue growth and cost reduction could both be achieved if quality could be improved. By growing revenues and decreasing costs, profitability could be increased. After meeting with the managers of production, marketing, purchasing, and human resources, Maria made the following decisions, effective immediately (end of November 20x1): a. More will be invested in employee training. Workers will be trained to detect quality problems and empowered to make improvements. Workers will be allowed a bonus of 10 percent of any cost savings produced by their suggested improvements. b. Two design engineers will be hired immediately, with expectations of hiring one or two more within a year. These engineers will be in charge of redesigning processes and products with the objective of improving quality. They will also be given the responsibility of working with selected suppliers to help improve the quality of their products and processes. Design engineers were considered a strategic necessity. c. Implement a new process: evaluation and selection of suppliers. This new process has the objective of selecting a group of suppliers that are willing and capable of providing nondefective components. d. Effective immediately, the division will begin inspecting purchased components. According to production, many of the quality problems are caused by defective components purchased from outside suppliers. Incoming inspection is viewed as a transitional activity. Once the division has developed a group of suppliers capable of delivering nondefective components, this activity will be eliminated. e. Within three years, the goal is to produce products with a defect rate less than 0.10 percent. By reducing the defect rate to this level, marketing is confident that market share will increase by at least 50 percent (as a consequence of increased customer satisfaction). Products with better quality will help establish an improved product image and reputation, allowing the division to capture new customers and increase market share. f. Accounting will be given the charge to install a quality information reporting system. Daily reports on operational quality data (e.g., percentage of defective units), weekly updates of trend graphs (posted throughout the division), and quarterly cost reports are the types of information required. g. To help direct the improvements in quality activities, kaizen costing is to be implemented. For example, for the year 20x1, a kaizen standard of 6 percent of the selling price per unit was set for rework costs, a 25 percent reduction from the current actual cost. To ensure that the quality improvements were directed and translated into concrete financial outcomes, Maria also began to implement a Balanced Scorecard for the division. By the end of 20x2, progress was being made. Sales had increased to 26,000,000, and the kaizen improvements were meeting or beating expectations. For example, rework costs had dropped to 1,500,000. At the end of 20x3, two years after the turnaround quality strategy was implemented, Maria received the following quality cost report: Maria also received an income statement for 20x3: Maria was pleased with the outcomes. Revenues had grown, and costs had been reduced by at least as much as she had projected for the two-year period. Growth next year should be even greater as she was beginning to observe a favorable effect from the higher-quality products. Also, further quality cost reductions should materialize as incoming inspections were showing much higher-quality purchased components. Required: 1. Identify the strategic objectives, classified by the Balanced Scorecard perspective. Next, suggest measures for each objective. 2. Using the results from Requirement 1, describe Marias strategy using a series of if-then statements. Next, prepare a strategy map. 3. Explain how you would evaluate the success of the quality-driven turnaround strategy. What additional information would you like to have for this evaluation? 4. Explain why Maria felt that the Balanced Scorecard would increase the likelihood that the turnaround strategy would actually produce good financial outcomes. 5. Advise Maria on how to encourage her employees to align their actions and behavior with the turnaround strategy.