A 4000 3000 2000 1500 1000 0.8- 0.6 0.4 0.2 3000 2000 1000 Transmittance% 100 50- C 4000 3000 2500 2000 1500 -1 1000 500 Wavenumbers / em Figure 1. IR spectra A, B and C
A 4000 3000 2000 1500 1000 0.8- 0.6 0.4 0.2 3000 2000 1000 Transmittance% 100 50- C 4000 3000 2500 2000 1500 -1 1000 500 Wavenumbers / em Figure 1. IR spectra A, B and C

Organic Chemistry
8th Edition
ISBN:9781305580350
Author:William H. Brown, Brent L. Iverson, Eric Anslyn, Christopher S. Foote
Publisher:William H. Brown, Brent L. Iverson, Eric Anslyn, Christopher S. Foote
Chapter12: Infrared Spectroscopy
Section: Chapter Questions
Problem 12.6P: Following are infrared spectra of nonane and 1-hexanol. Assign each compound its correct spectrum.

Related questions
Question
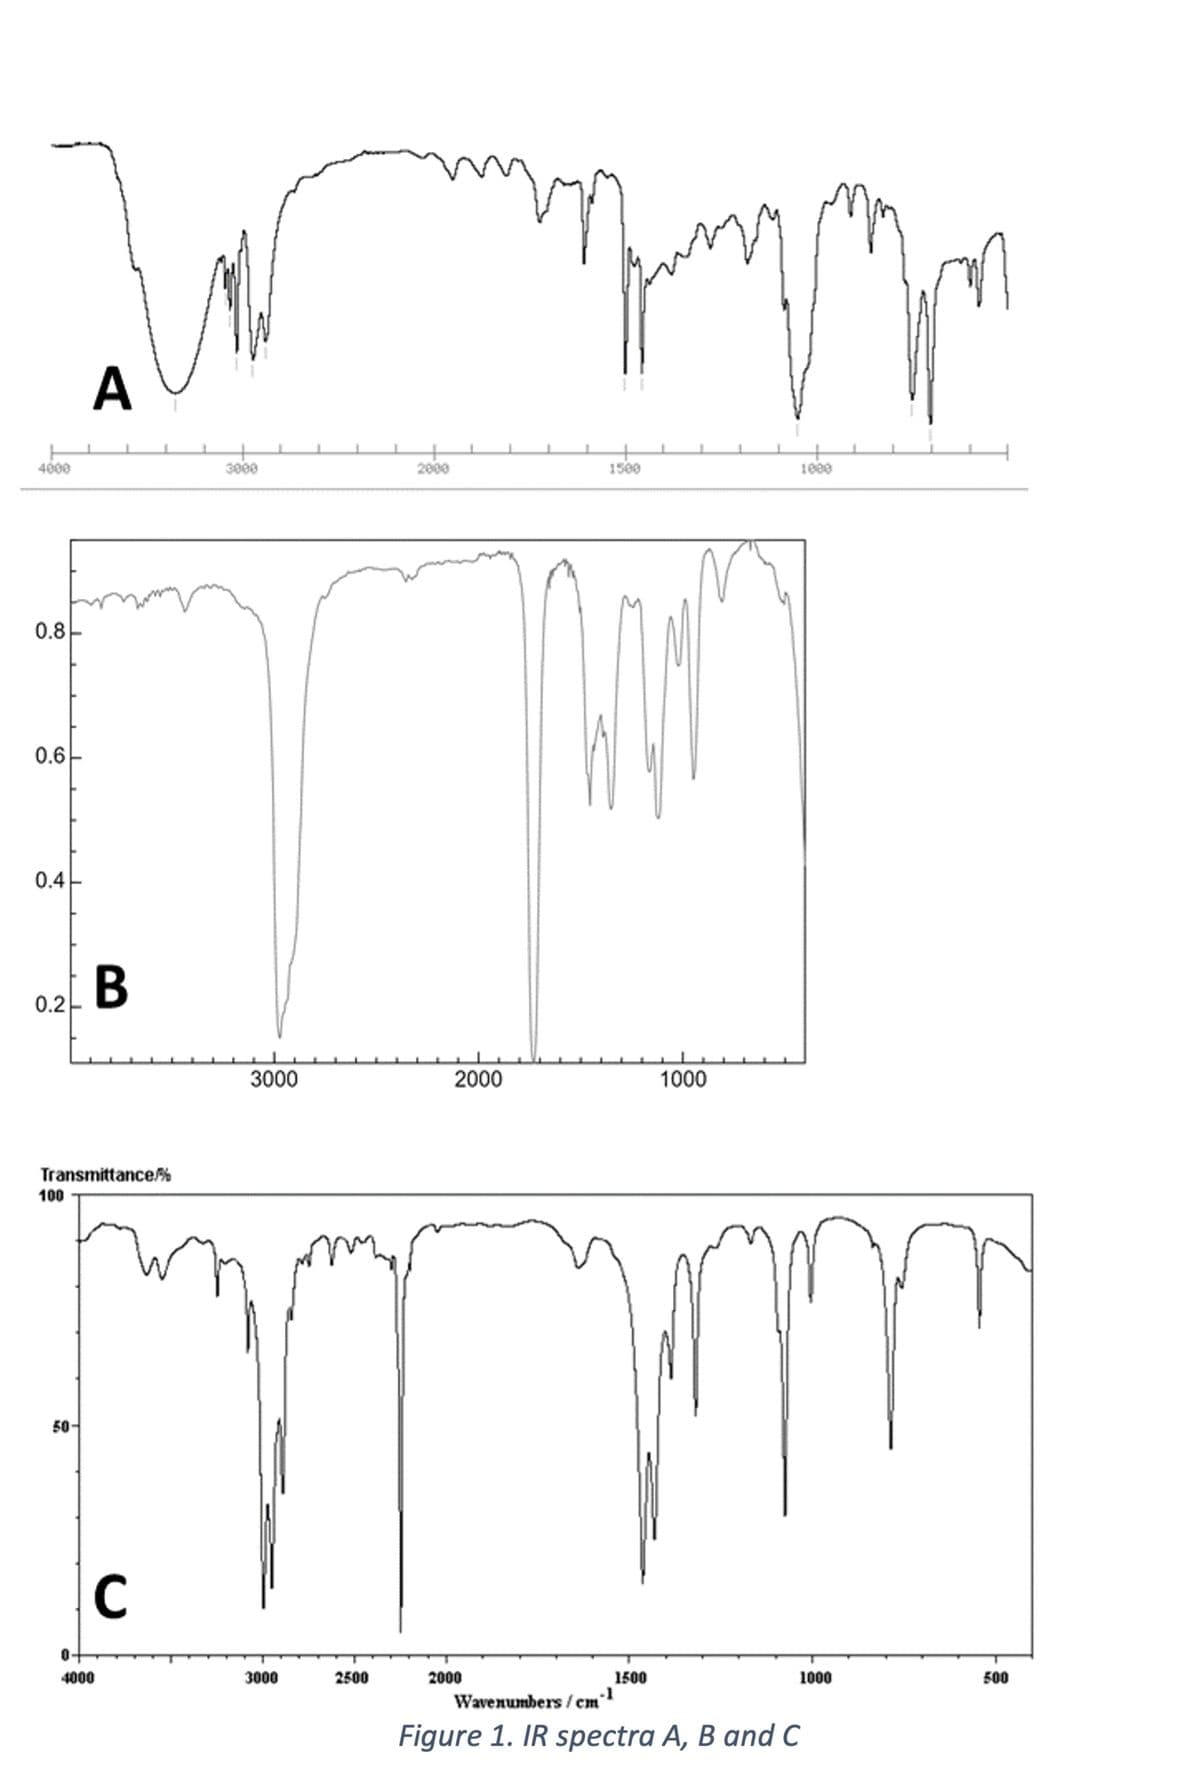
1a) Draw the keto-enol equilibrium reaction for the following
1b) Figure 1 shows three IR spectra, labelled A, B and C. Identify which one corresponds to the ketone shown in section 1a). Justify your answer by discussing the appropriate bands of the three spectra.
Transcribed Image Text:A
4000
3000
2000
1500
1000
0.8-
0.6-
0.4-
B
0.2
3000
2000
1000
Transmittance%
100
50
C
4000
3000
2500
2000
1500
1000
500
Wavenumbers / cm
Figure 1. IR spectra A, B and C

Expert Solution
This question has been solved!
Explore an expertly crafted, step-by-step solution for a thorough understanding of key concepts.

Step by step
Solved in 2 steps with 2 images

Knowledge Booster


Learn more about
Need a deep-dive on the concept behind this application? Look no further. Learn more about this topic, chemistry and related others by exploring similar questions and additional content below.Recommended textbooks for you
Organic Chemistry
Chemistry
ISBN:
9781305580350
Author:
William H. Brown, Brent L. Iverson, Eric Anslyn, Christopher S. Foote
Publisher:
Cengage Learning

Macroscale and Microscale Organic Experiments
Chemistry
ISBN:
9781305577190
Author:
Kenneth L. Williamson, Katherine M. Masters
Publisher:
Brooks Cole
Organic Chemistry
Chemistry
ISBN:
9781305580350
Author:
William H. Brown, Brent L. Iverson, Eric Anslyn, Christopher S. Foote
Publisher:
Cengage Learning
Macroscale and Microscale Organic Experiments
Chemistry
ISBN:
9781305577190
Author:
Kenneth L. Williamson, Katherine M. Masters
Publisher:
Brooks Cole