A B A В 35 42 45 39 41 Given the following data from a randomized experiment, construct the randomized reference distribution and use it to estimate the significance of the difference between methods A and B B.


Q: A- Explain the following • Random Experiments. • The Variance of data. Bayes' Theorem.
A: 1. Random Experiments: A Random Experiment is an experiment, trial, or observation that can be…
Q: The following data are from a completely randomized design. In the following calculations, use a =…
A: Given: Treatment 1 Treatment 2 Treatment 3 62 82 68 46 71 54 53 88 61 39 63 45
Q: To determine if the means of three or more populations are equal, you should use: Select one: a.…
A: We want to tell you which one is the correct choicec
Q: Q2- Consumer Reports provides information on new automobile models, including price, mileage…
A: "Since you have posted a question with multiple subparts, we will solve first 3 sub-parts for you.…
Q: In a study to compare two different methods of teaching reading, a class of 20 children was divided…
A: Given: Method 1 Method 2 80 79 85 62 79 75 81 68 89 62 73 73 50 76 71 81 76 73…
Q: Determine whether each of the following experiments/situations involve a discrete or a continuous…
A: A Discrete random variable: It can be defined as a variable that has a finite or countable number of…
Q: Given below are the analysis of variance results from a Minitab display. Assume that you want to use…
A: Given, P-value =0.264
Q: 1. The data shown below represent the number of hours of pain relief provided by 5 different brands…
A:
Q: Two kinds of thread are being compared for strength. The data are as follows: (kg) Brand A: 78.3 s…
A:
Q: Q2- Consumer Reports provides information on new automobile models, including price, mileage…
A: "Since you have posted a question with multiple subparts, we will solve first 3 sub-parts for you.…
Q: A fiber spinning process produces a fiber whose strength is normally distributed with average of…
A: Given that X~Normal(μ= 78.9 , σ2 = 30 ) μ=78.9 , σ=√30=5.48 Minimum acceptable resistance=65.7…
Q: Source DF SS MS F P Treatment 4 1010.56 ? 29.84 ? Block ? ? 64.765 ? ? Error 20 169.33 ?…
A:
Q: Given below are the analysis of variance results from a Minitab display. Assume that you want to use…
A: The test statistic used here is F statistic.
Q: When subjects were treated with a drug, their systolic blood pressure readings (in mm Hg) were…
A: Given information- Sample size, n = 12 Significance level = 0.01
Q: Select THREE benefits of using within-subjects t-test compared to between- subjects t-test. O No…
A: THREE benefits of using within-subjects t-test compared to between subjects t-test.
Q: A cample mean is computed from a population with a variance of 2.45. The sample size is 40. The…
A: Given,variance(σ2)=2.45standard deviation(σ)=2.45sample size(n)=40
Q: The following table shows the results of a one-way analysis of variance comparing three treatment…
A: Option a
Q: (C). At the α = 0.01, test whether the means for the three treatments are equal. Using F table,…
A: (c) 1. At the α=0.01, the possible range of values of the p-value: The correct choice is: Using…
Q: their statistics finals? Final exam scores of ten randomly selected male statistics students and…
A:
Q: 6. The three samples below have been obtained from normal populations with equal variances. Test the…
A: To compare the population means of more than 2 groups the ANOVA F single factor test is used. This…
Q: In a completely randomized design involving four treatments, the following information is provided.…
A:
Q: Exercise 4.39 describes a study to investigate whether a recorded phone call is more effective than…
A: a) The null and alternative hypotheses are: H0: pc = pf vs Ha: pc > pf. Based on this, it can be…
Q: The data below are from an independent-measures experiment comparing three different treatment…
A: a.Here the significance of mean difference among the three treatments are compared so ANOVA is used…
Q: A rescarcher observed the pattern of college students' attention span (in hours) in their Math…
A: The probability distribution is valid if ∑PZ=z=1. Then, the missing probability, p…
Q: To test whether or not there is a difference between treatments A, B, and C, a sample of 12…
A: Given : To test whether or not there is a difference between treatments A, B, and C, a sample of 12…
Q: Q2- Consumer Reports provides information on new automobile models, including price, mileage…
A: Note- As per our policy we can answer only the first 3 sub-parts of a question. If you want…
Q: Members of fraternities and sororities are required to volunteer for community service. Do…
A: State the hypotheses. The first step is to state the null hypothesis and an alternative hypothesis.…
Q: Here is a random sample of turkey wight. Assume turkey weight is normally distributed. 15 16…
A: The data shows the turkey weights which is normally distributed. The claim is that the mean weight…
Q: Given below are the analysis of variance results from a Minitab display. Assume that you want to use…
A:
Q: The dry shear strength of birch plywood bonded with different resin glues was studied with a…
A: Solution
Q: 28 47 47 31 さ 56 。 以88 5 %8 さ8 手出88 =55高 。
A:
Q: The following data are from a completely randomized design. Treatment A B 162 142 126 142 156 122…
A: List of formulae : Sum of squares between treatment : SSTr = n1(x¯1 -x¯)2+n2(x¯2 -x¯)2+n3(x¯3 -x¯)2…
Q: he following data are from a completely randomized design. In the following calculations, use a =…
A: This is an ANOVA test for a single factor. Given, By using excel, Enter the Data in ExcelGo to…
Q: Which of the following accurately describes the effect of increasing the sample size? a. Increases…
A: We have given the multiple choice question, Which of the following accurately describes the effect…
Q: Do men score lower on average compared to women on their statistics finals? Final exam scores of…
A: We shall use sample two test with unequal variance. b) The mean and standard deviation are…
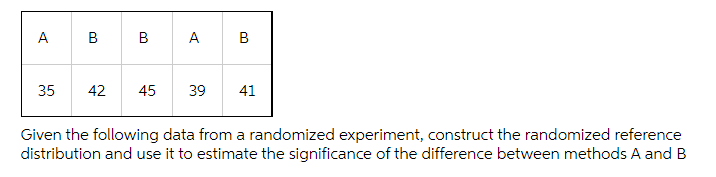
Q: A B B A B 35 42 45 39 41 Given the following data from a randomized experiment, construct…
A: Randomized Reference distribution: The randomized reference distribution is the Histogram of all the…
Q: In a study to compare two different methods of teaching reading, a class of 20 children was divided…
A: Outliers in a data set are those values, which are significantly small or large compared to other…
Q: In a study to compare two different methods of teaching reading, a class of 20 children was divided…
A: Given data isFor Method 1:-80,85,79,81,89,73,50,71,76For Method 2:-2,79,62,75,68,62,73,76,81,73,61
Q: The following data are from a completely randomized design. In the following calculations, use ? =…
A: Hello! As you have posted more than 3 sub parts, we are answering the first 3 sub-parts. In case…
Q: The following data are from a completely randomized design. In the following calculations, use ? =…
A: Given, Treatment Treatment Treatment 1 2 3 62 82 70 46 71 53 53 87 60 39 64 45 Level…
Q: Ice cream usually comes in 1.5 quart boxes (48 fluid ounces), and ice cream scoops hold about 2…
A: Given Information: X=Amount of ice cream in the box. Y=Amount of ice cream scooped out. Mean…
Q: You may need to use the appropriate technology to answer this question. The following data are from…
A: a) The null and alternate hypothesis is H0 : μ1=μ2=μ3HA : Not all the population means are equal (As…
Q: The following data are from a completely randomized design. Treatment Treatment Treatment A B 32 44…
A: An ANOVA is a statistical tool used to test the population mean of two or more than two groups.…
Q: The following data are from a study on Botox injections. Patients received a high-dose injection in…
A: (1) Determine type of test is used to conduct given the situation. The type of test used for the…
Q: Given below are the analysis of variance results from a Minitab display. Assume that you want to use…
A: In this case, we need to identify the test statistic value.
Q: Two samples of sizes 24 and 35 are independently drawn from two normal populations, where the…
A: The sample sizes for sample 1 and sample 2 are, Consider that the variances are equal The formula…
Q: Do the poor spend less time in the shower than the rich? The results of a survey asking poor and…
A: The t-test statistic is, t=x¯1-x¯2s12n1+s22n2where,x¯1, x¯2=sample meanss1, s2=sample standard…
Q: The nicotine content in miligrams of two samples of tobacco were found to be as Lallows: 25 26 21 27…
A:
Q: In an industrial experiment, a job was performed by 10 workers using Method I, and by 7 workers…
A: Given n1=10, x̄1=17, s21=26 n2=7, x̄2=9, s22=7, level of significance ɑ=0.05
Q: Given below are the analysis of variance results from a Minitab display. Assume that you want to use…
A: Given:: The output of minitab is shown below Source DF SS MS F p Factor 3 13.500 4.500 5.17…

Step by step
Solved in 4 steps with 4 images

- An experiment is to be carried out with three different drugs for treating migraine. 16 patients of similar age, health condition and migraine problems are identified. Give the layout (before randomization) of a designed experiment to carry out this experiment. Write down the model for analysing the data and show the ANOVA table format with the expressions for the Sums of squares.Gastric freezing was once a recommended treatment for ulcers in the upper intestine. Use of gastric freezing stopped after experiments showed it had no effect. One randomized comparative experiment found that 28 of 82 gastric freezing patients improved, while 30 of the 78 patients in the placebo group improved. We can test the hypothesis of “no difference” between the two groups in two ways: using the two-sample z statistic or using the chi-square statistic A. State the null hypothesis with a two-sided alternative and carry out the z test for proportions. Assume that the conditions are met, what are the test statistic and the p-value. B. Present the data in a 2X2 table and complete the chi-square test. Assume the conditions are met, what are the test statistics and p-value. C. Square the test statistic in part (a) and compare it to the test statistic in part (b.) What do you notice.In a completely randomized design, seven experimental units were used for each of the five levels of the factor. Complete the following ANOVA table (to 2 decimals, if necessary). Round p-value to four decimal places. If your answer is zero enter "0". Source of Variation Sum of Squares Degrees of Freedom Mean Square F p-value Treatments 300 Error Total 460 What hypotheses are implied in this problem? 0: SelectAll five treatment means are equal not all five treatment means are equalItem 9 a: SelectAll five treatment means are equal not all five treatment means are equalItem 10 At the = .05 level of significance, can we reject the null hypothesis in part (a)?Calculate the value of the test statistic (to 2 decimals). The p-value is Selectless than .01between .01 and .025between .025 and .05between .05 and .10greater than .10Item 12 What is your conclusion?SelectConclude, not all five treatment means are equal can not reject the assumption all five…
- ester Hollar is vice president for human resources for a large manufacturing company. In recent years, he has noticed an increase in absenteeism that he thinks is related to the general health of the employees. Four years ago, in an attempt to improve the situation, he began a fitness program in which employees exercise during their lunch hour. To evaluate the program, he selected a random sample of eight participants and found the number of days each was absent in the six months before the exercise program began and in the six months following the exercise program. Below are the results. Employee Before After 1 6 5 2 6 2 3 7 1 4 7 3 5 4 3 6 3 6 7 5 3 8 6 7 At the 0.05 significance level, can he conclude that the number of absences has declined? Estimate the p-value. State the decision rule for 0.05 significance level. (Round your answer to 3 decimal places.) Compute the test statistic. (Round your answer to 3 decimal places.)The Department of Motor Safety is conducting a study to determine how many hours each weekcar and truck drivers drive. In order to assess this, they equipped special trackers in 50 cars andtrucks. They received the following information: Truck Drivers Car DriversX̄ = 19.5s = 4.75n = 50 X̄ = 17s = 3.5n = 50 What type of statistical test should we use to compare means (independent z-test,independent t-test, dependent t-test, or ANOVA)? Why?The Admissions Office at a small university has developed a new 10-minute video about the university to send to prospective students. Before mass-producing the DVD, they would like to test whether it is more effective than the current video. Suppose that you have 12 high school student volunteers who have agreed to take part in an experiment. The explanatory variable to be studied is the type of video, with two levels OLD and NEW. Would you describe your study as a randomized comparative experiment, a matched pair experiment, or an observational study? Briefly explain.
- Please help with areas marked with an X, I got the rest of the data from running Anova which provided me with the information below, but the first few rows were incorrect, not sure what I am doing wrong. Please help 13.4 Excel Activity 1 - ANOVA with XLMiner Analysis ToolPak, Randomized Block Design (Freeform) A study measuring the fatigue of air traffic controllers resulted in proposals for modification and redesign of the controllers' workstation. After consideration of several designs for the workstation, three specific alternatives are selected as having the best potential for reducing controller stress. The key question is: To what extent do the three alternatives differ in terms of their effect on controller stress? A randomized block design is used to test the hypothesis of no difference in stress levels for the three workstation alternatives. The data for the experiment is located in the Microsoft Excel Online file below. Use ? = 0.1 to test for any significant…In a completely randomized design, seven experimental units were used for each of the five levels of the factor. The sum of squared due to treatments equals 300 and the total sum of squares equals 460. You use = .01 and conduct an analysis of variance to test for the equality of the population means for the completely randomized design. You compute the critical value for this test statistic and find it is equal t0? Your conclusion is to reject or not H0 (significant difference in the populations)How many samples should be selected when the total population is 31 for goldfeld and quandt test to find the heteroscasticity??
- A researcher wishes to determine whether the blood pressure of vegetarians is, on average, lower than the blood pressure of nonvegetarians. Independent simple random samples of 85 vegetarians and 75 nonvegetarians yielded the following sample statistics for systolic blood pressure. Test the claim that vegetarians have lower blood pressure than non vegetarians how do you Use a 0.05 level of significance?True or false; Hypothesis testing on samples with fewer than 30 participants can be carried out by using the t-value for the corresponding level of significance in place of the zvalue when setting up the decision rule.In a completely randomized design, 12 experimental units were used for the first treatment 15 for the second treatment, and 20 for the third treatment. Comple the following analysis of variance (to 2 decimals, if necessary). Treatments F ? Treatment P-Value ? Thank you


