a) Briefly discuss the differences between attribute and variable quality measures. b) Discuss the difference between p-chart and c-chart.
a) Briefly discuss the differences between attribute and variable quality measures. b) Discuss the difference between p-chart and c-chart.

Practical Management Science
6th Edition
ISBN:9781337406659
Author:WINSTON, Wayne L.
Publisher:WINSTON, Wayne L.
Chapter14: Data Mining
Section14.2: Classification Methods
Problem 1P: The file P14_01.xlsx contains data on 100 consumers who drink beer. Some of them prefer light beer,...

Related questions
Question
Transcribed Image Text:Question
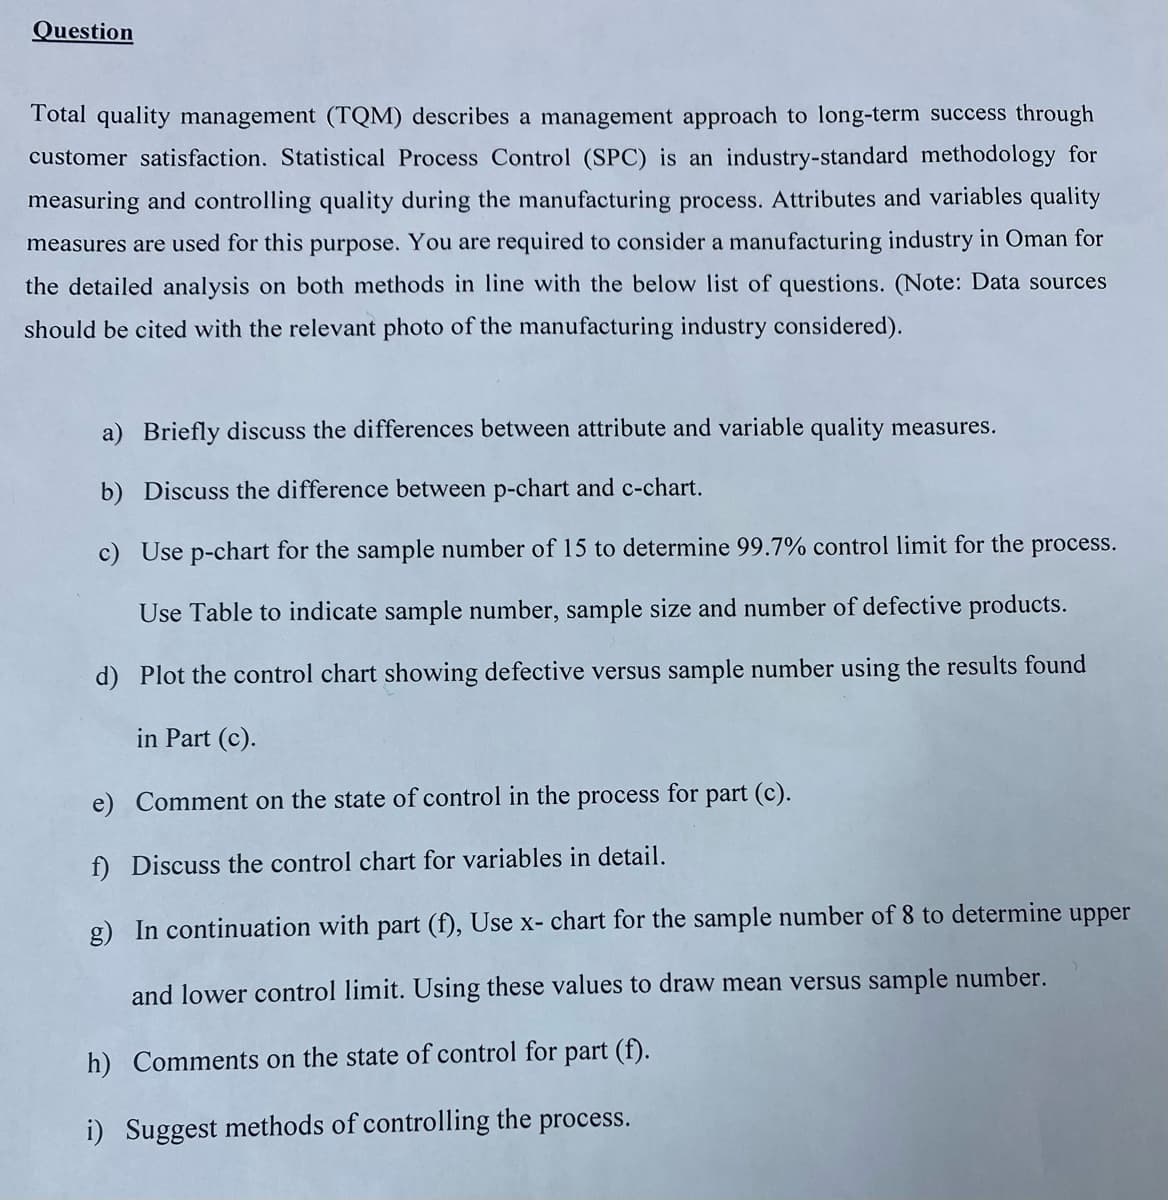
Total quality management (TQM) describes a management approach to long-term success through
customer satisfaction. Statistical Process Control (SPC) is an industry-standard methodology for
measuring and controlling quality during the manufacturing process. Attributes and variables quality
measures are used for this purpose. You are required to consider a manufacturing industry in Oman for
the detailed analysis on both methods in line with the below list of questions. (Note: Data sources
should be cited with the relevant photo of the manufacturing industry considered).
a) Briefly discuss the differences between attribute and variable quality measures.
b) Discuss the difference between p-chart and c-chart.
c) Use p-chart for the sample number of 15 to determine 99.7% control limit for the process.
Use Table to indicate sample number, sample size and number of defective products.
d) Plot the control chart showing defective versus sample number using the results found
in Part (c).
e) Comment on the state of control in the process for part (c).
f) Discuss the control chart for variables in detail.
g) In continuation with part (f), Use x- chart for the sample number of 8 to determine upper
and lower control limit. Using these values to draw mean versus sample number.
h) Comments on the state of control for part (f).
i) Suggest methods of controlling the process.
Expert Solution
This question has been solved!
Explore an expertly crafted, step-by-step solution for a thorough understanding of key concepts.

Step by step
Solved in 2 steps

Recommended textbooks for you
Practical Management Science
Operations Management
ISBN:
9781337406659
Author:
WINSTON, Wayne L.
Publisher:
Cengage,
Practical Management Science
Operations Management
ISBN:
9781337406659
Author:
WINSTON, Wayne L.
Publisher:
Cengage,