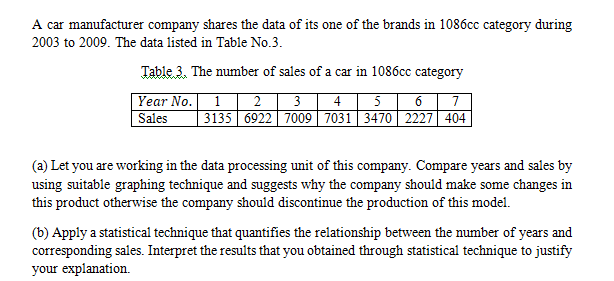
A car manufacturer company shares the data of its one of the brands in 1086cc category during 2003 to 2009. The data listed in Table No.3. Table 3. The number of sales of a car in 1086cc category Year No. 1 Sales 3| 4 | 5 | 6| 7 | 3135 | 6922 | 7009| 7031| 3470| 2227| 404 2 (a) Let you are working in the data processing unit of this company. Compare years and sales by using suitable graphing technique and suggests why the company should make some changes in this product otherwise the company should discontinue the production of this model. (b) Apply a statistical technique that quantifies the relationship between the number of years and corresponding sales. Interpret the results that you obtained through statistical technique to justify your explanation.
A car manufacturer company shares the data of its one of the brands in 1086cc category during 2003 to 2009. The data listed in Table No.3. Table 3. The number of sales of a car in 1086cc category Year No. 1 Sales 3| 4 | 5 | 6| 7 | 3135 | 6922 | 7009| 7031| 3470| 2227| 404 2 (a) Let you are working in the data processing unit of this company. Compare years and sales by using suitable graphing technique and suggests why the company should make some changes in this product otherwise the company should discontinue the production of this model. (b) Apply a statistical technique that quantifies the relationship between the number of years and corresponding sales. Interpret the results that you obtained through statistical technique to justify your explanation.

Big Ideas Math A Bridge To Success Algebra 1: Student Edition 2015
1st Edition
ISBN:9781680331141
Author:HOUGHTON MIFFLIN HARCOURT
Publisher:HOUGHTON MIFFLIN HARCOURT
Chapter9: Solving Quadratic Functions
Section: Chapter Questions
Problem 4CA

Related questions

Concept explainers
Transformation of Graphs
The word ‘transformation’ means modification. Transformation of the graph of a function is a process by which we modify or change the original graph and make a new graph.
Exponential Functions
The exponential function is a type of mathematical function which is used in real-world contexts. It helps to find out the exponential decay model or exponential growth model, in mathematical models. In this topic, we will understand descriptive rules, concepts, structures, graphs, interpreter series, work formulas, and examples of functions involving exponents.
Question
Transcribed Image Text:A car manufacturer company shares the data of its one of the brands in 1086cc category during
2003 to 2009. The data listed in Table No.3.
Table 3. The number of sales of a car in 1086cc category
Year No. 1
Sales
3| 4 | 5 | 6| 7
| 3135 | 6922 | 7009| 7031| 3470| 2227| 404
2
(a) Let you are working in the data processing unit of this company. Compare years and sales by
using suitable graphing technique and suggests why the company should make some changes in
this product otherwise the company should discontinue the production of this model.
(b) Apply a statistical technique that quantifies the relationship between the number of years and
corresponding sales. Interpret the results that you obtained through statistical technique to justify
your explanation.
Expert Solution
This question has been solved!
Explore an expertly crafted, step-by-step solution for a thorough understanding of key concepts.

This is a popular solution!

Trending now
This is a popular solution!

Step by step
Solved in 3 steps with 2 images

Knowledge Booster


Learn more about
Need a deep-dive on the concept behind this application? Look no further. Learn more about this topic, statistics and related others by exploring similar questions and additional content below.Recommended textbooks for you
Big Ideas Math A Bridge To Success Algebra 1: Stu…
Algebra
ISBN:
9781680331141
Author:
HOUGHTON MIFFLIN HARCOURT
Publisher:
Houghton Mifflin Harcourt

Algebra & Trigonometry with Analytic Geometry
Algebra
ISBN:
9781133382119
Author:
Swokowski
Publisher:
Cengage

Glencoe Algebra 1, Student Edition, 9780079039897…
Algebra
ISBN:
9780079039897
Author:
Carter
Publisher:
McGraw Hill
Big Ideas Math A Bridge To Success Algebra 1: Stu…
Algebra
ISBN:
9781680331141
Author:
HOUGHTON MIFFLIN HARCOURT
Publisher:
Houghton Mifflin Harcourt
Algebra & Trigonometry with Analytic Geometry
Algebra
ISBN:
9781133382119
Author:
Swokowski
Publisher:
Cengage
Glencoe Algebra 1, Student Edition, 9780079039897…
Algebra
ISBN:
9780079039897
Author:
Carter
Publisher:
McGraw Hill