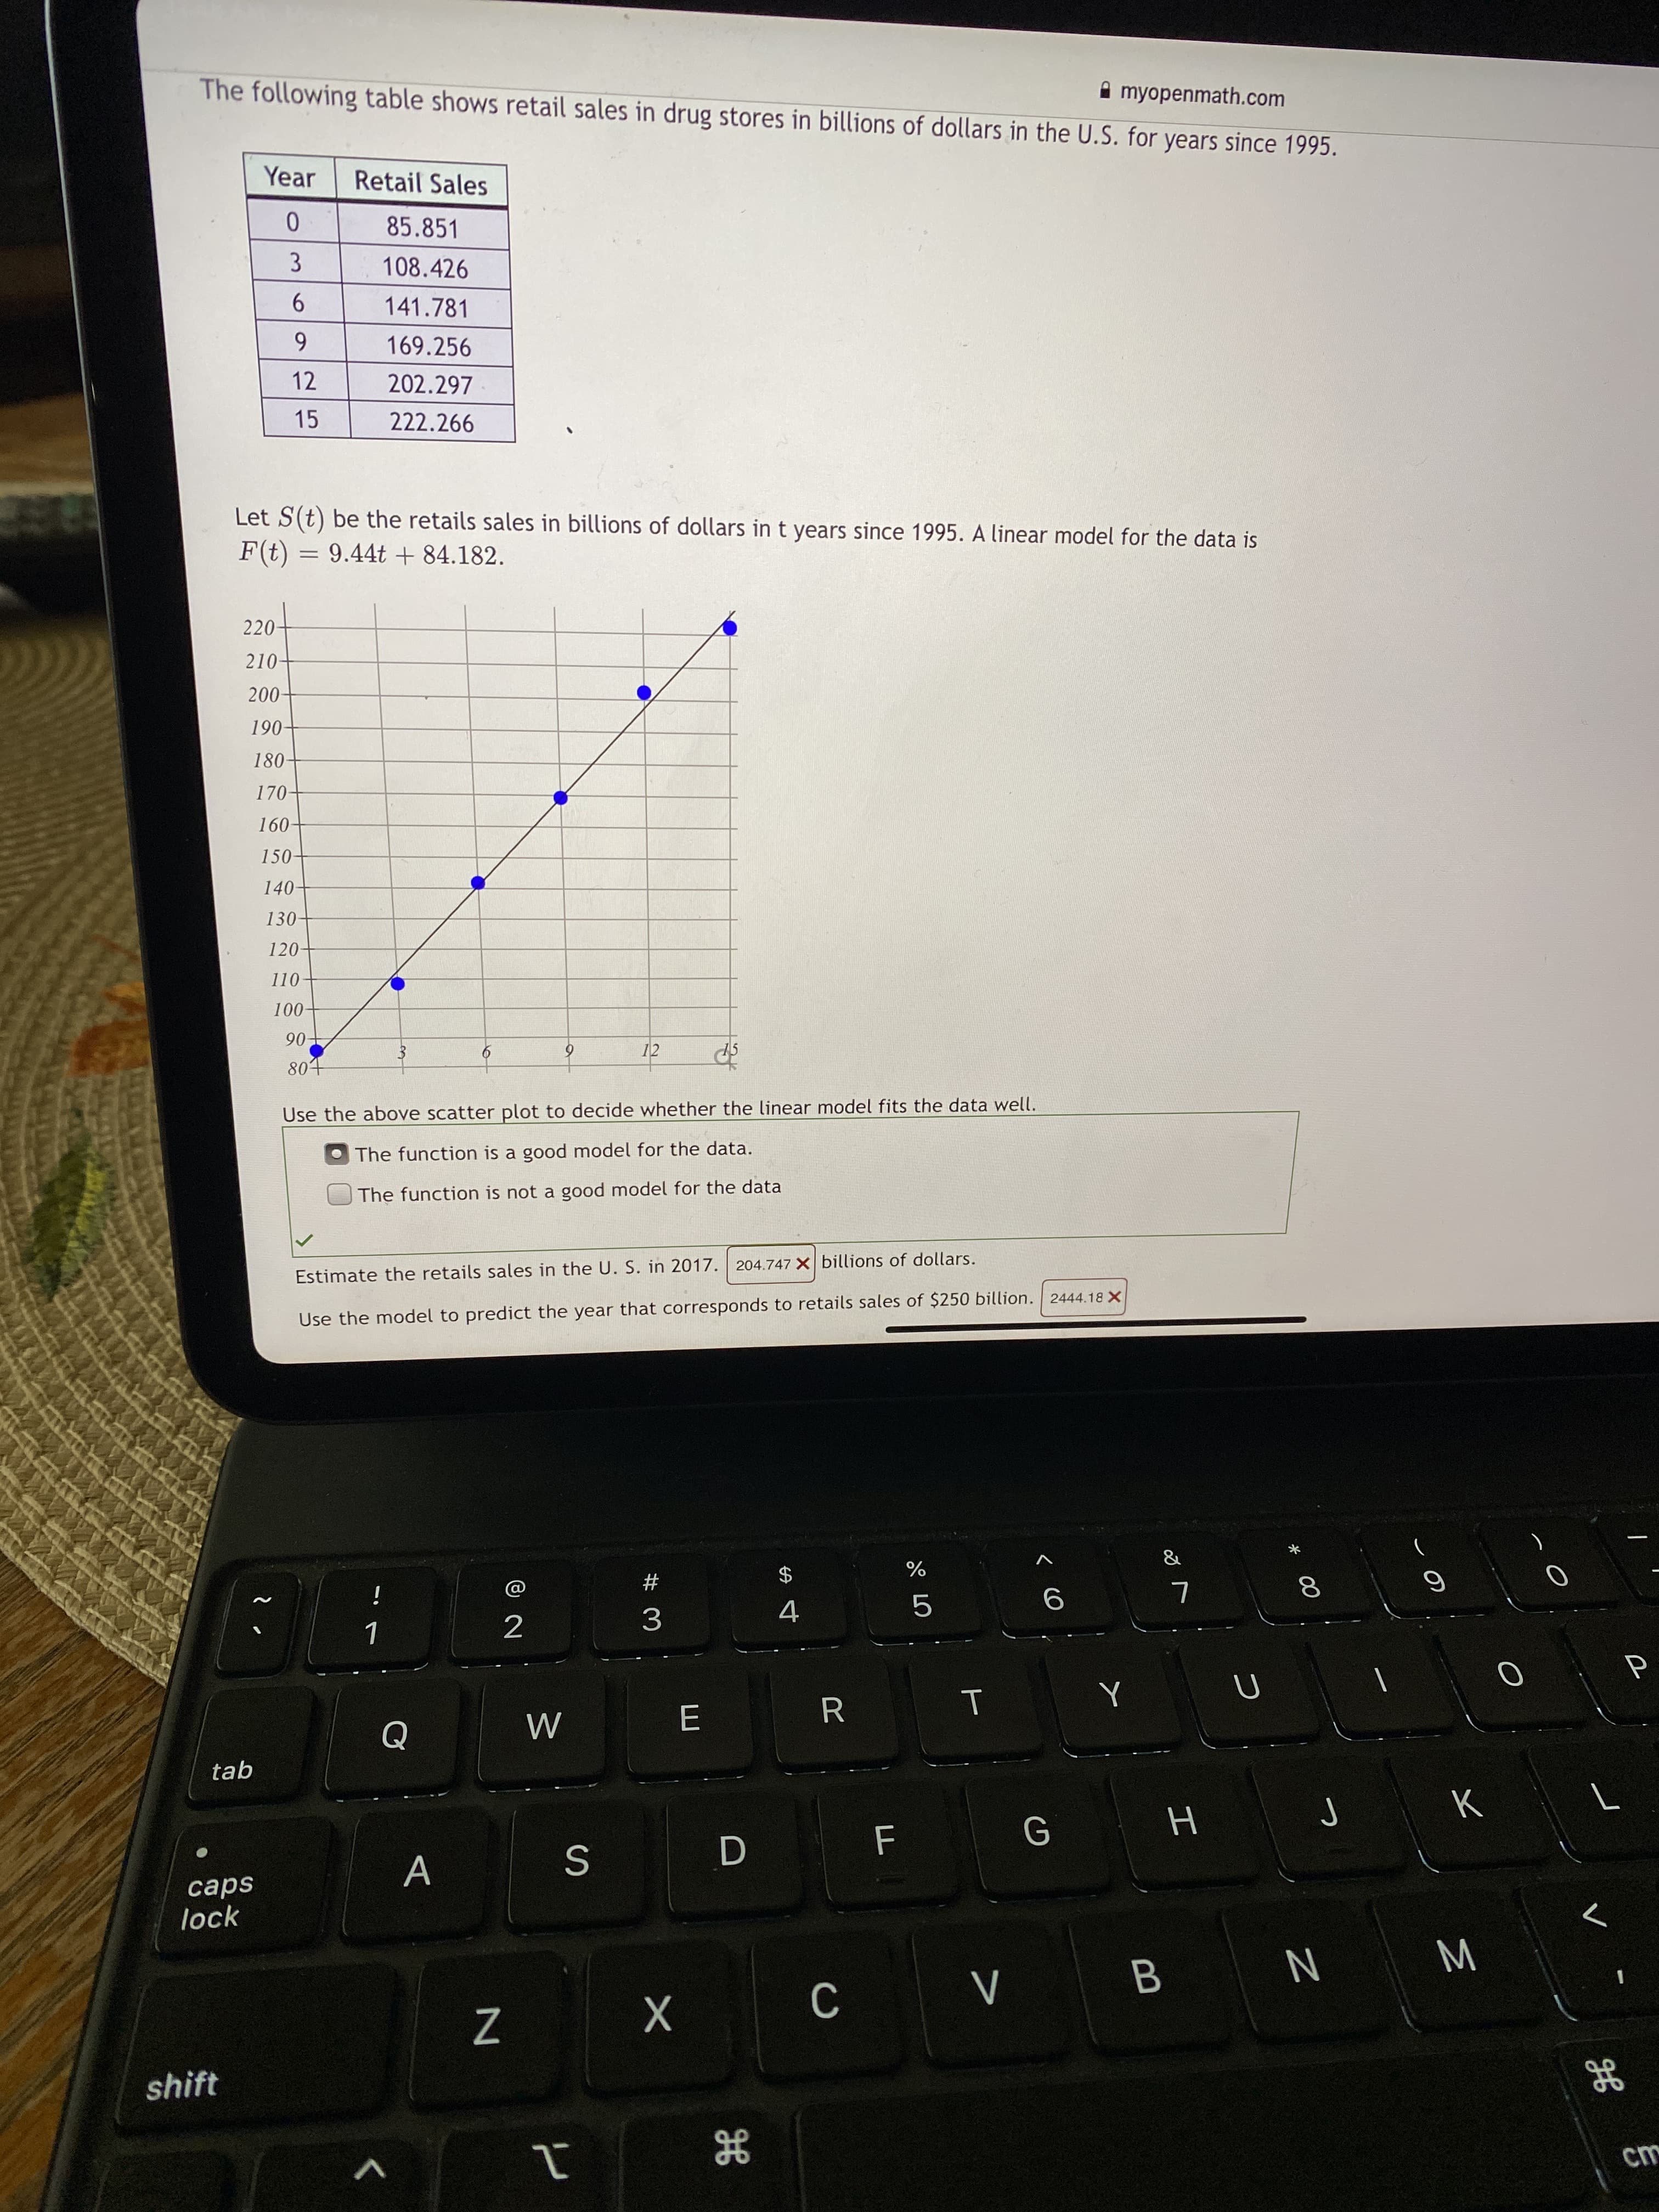
A myopenmath.com The following table shows retail sales in drug stores in billions of dollars in the U.S. for years since 1995. Year Retail Sales 85.851 108.426 6. 141.781 9. 169.256 12 202.297 15 222.266
A myopenmath.com The following table shows retail sales in drug stores in billions of dollars in the U.S. for years since 1995. Year Retail Sales 85.851 108.426 6. 141.781 9. 169.256 12 202.297 15 222.266

Chapter3: Polynomial Functions
Section3.5: Mathematical Modeling And Variation
Problem 1ECP: The ordered pairs below give the median sales prices y (in thousands of dollars) of new homes sold...

Related questions
Question
I need help with the last two questions I keep getting that part wrong
Transcribed Image Text:00
I
T
F.
A myopenmath.com
The following table shows retail sales in drug stores in billions of dollars in the U.S. for years since 1995.
Year
Retail Sales
85.851
3
108.426
141.781
9.
6.
12
169.256
202.297
15
222.266
Let S(t) be the retails sales in billions of dollars in t years since 1995. A linear model for the data is
F(t) =
9.44t + 84.182.
220-
210-
200-
060-
180-
170-
160-
150
140-
130-
120-
110
00-
90-
804
12
Use the above scatter plot to decide whether the linear model fits the data well.
The function is a good model for the data.
The function is not a good model for the data
Estimate the retails sales in the U. S. in 2017. 204.747 X billions of dollars.
Use the model to predict the year that corresponds to retails sales of $250 billion. 2444.18 X
&
#
$
i
4.
3.
R.
tab
G
A
lock
W N g ^ Ɔ
shift
Expert Solution
This question has been solved!
Explore an expertly crafted, step-by-step solution for a thorough understanding of key concepts.

This is a popular solution!

Trending now
This is a popular solution!

Step by step
Solved in 3 steps

Recommended textbooks for you

Functions and Change: A Modeling Approach to Coll…
Algebra
ISBN:
9781337111348
Author:
Bruce Crauder, Benny Evans, Alan Noell
Publisher:
Cengage Learning

Algebra & Trigonometry with Analytic Geometry
Algebra
ISBN:
9781133382119
Author:
Swokowski
Publisher:
Cengage
Functions and Change: A Modeling Approach to Coll…
Algebra
ISBN:
9781337111348
Author:
Bruce Crauder, Benny Evans, Alan Noell
Publisher:
Cengage Learning
Algebra & Trigonometry with Analytic Geometry
Algebra
ISBN:
9781133382119
Author:
Swokowski
Publisher:
Cengage

Algebra and Trigonometry (MindTap Course List)
Algebra
ISBN:
9781305071742
Author:
James Stewart, Lothar Redlin, Saleem Watson
Publisher:
Cengage Learning