A Cell-to-cell transmission > (Relative, %) C Infection (RLU x10³) E Infection (RLU x104) G 1.51 1.0 0.5- 0.0- 2 + 3 NO SARS-CoV (PV) SARS-CoV-2 (PV) 0 0.2 0.5 1.5 0 0.2 0.5 1.5 293T to H520 (SARS-CoV-2 (PV)) Day 293T to PBMC (SARS-CoV-2 (PV)) 4 Day 20 h →Cell-to-cell 4 Cell-free 1.51 Cell-to-cell +Cell-free 1.0- 0.5- mTomato-Red 2 5.24% 12.3% 1.18% 4h 3 73.2% 6.17% 9.32% 7.45% 0.507% 1.31% 71.7% 14.7% 0.713% ACE2 (ug) B Cell-free infection (Relative, %) D Infection (RLU x10³) F 85.0T Infection (RLU x104) 2.51 2.0- 1.5- 1.0- 0.5- 0.0- 801 60- Cell-to-cell (NCI-H520) Cell-free (NCI-H520) SARS-CoV (PV) SARS-CoV-2 (PV) 0 0.2 0.5 1.5 0 0.2 0.5 1.5 293T to H520 (SARS-CoV (PV)) →Cell-to-cell +Cell-free 4 Day 293T to PBMC (SARS-CoV (PV)) →-Cell-to-cell 4 Day SARS-CoV-2 WA1 (authentic) Cell-free (co-culture) Cell-to-cell www 20+Cell-free 0 H Infection (Q3, %) 201 15- 10- 0. ACE2 (ug)
A Cell-to-cell transmission > (Relative, %) C Infection (RLU x10³) E Infection (RLU x104) G 1.51 1.0 0.5- 0.0- 2 + 3 NO SARS-CoV (PV) SARS-CoV-2 (PV) 0 0.2 0.5 1.5 0 0.2 0.5 1.5 293T to H520 (SARS-CoV-2 (PV)) Day 293T to PBMC (SARS-CoV-2 (PV)) 4 Day 20 h →Cell-to-cell 4 Cell-free 1.51 Cell-to-cell +Cell-free 1.0- 0.5- mTomato-Red 2 5.24% 12.3% 1.18% 4h 3 73.2% 6.17% 9.32% 7.45% 0.507% 1.31% 71.7% 14.7% 0.713% ACE2 (ug) B Cell-free infection (Relative, %) D Infection (RLU x10³) F 85.0T Infection (RLU x104) 2.51 2.0- 1.5- 1.0- 0.5- 0.0- 801 60- Cell-to-cell (NCI-H520) Cell-free (NCI-H520) SARS-CoV (PV) SARS-CoV-2 (PV) 0 0.2 0.5 1.5 0 0.2 0.5 1.5 293T to H520 (SARS-CoV (PV)) →Cell-to-cell +Cell-free 4 Day 293T to PBMC (SARS-CoV (PV)) →-Cell-to-cell 4 Day SARS-CoV-2 WA1 (authentic) Cell-free (co-culture) Cell-to-cell www 20+Cell-free 0 H Infection (Q3, %) 201 15- 10- 0. ACE2 (ug)

Chapter16: Adult And Pediatric Dosages Based On Body Surface Area
Section: Chapter Questions
Problem 7.4P

Related questions
Question
Please help explain this figure
Transcribed Image Text:A
Cell-to-cell transmission >
(Relative, %)
C
Infection (RLU x10³)
E
1.5
1.0
0.5-
0.0-
Infection (RLU x10¹)
G
5-
2 + 3 N
4 Cell-free
1.51 Cell-to-cell
+Cell-free
1.0-
0.5-
0
H
mTomato-Red
2
0 0.2 0.5 1.5
293T to H520 (SARS-CoV-2 (PV))
→Cell-to-cell
2
4 Day
293T to PBMC (SARS-CoV-2 (PV))
4 Day
20 h
5.24%
I
SARS-CoV (PV)
SARS-CoV-2 (PV)
4h
ACE2
0 0.2 0.5 1.5 (pg)
B
71.7%
Cell-free infection
(Relative, %)
D
Infection (RLU x10³)
F
3
73.2% 6.17%
201
Cell-to-cell
(NCI-H520)
15-
14.7%
12.3%
1.18%
9.32% 7.45%
0.507% 1.31%
10-
0.713%
5-
Cell-free
(NCI-H520)
0.
198.0%
0.713%
0.338% 97.3%
SARS-CoV-2 N (FITC)
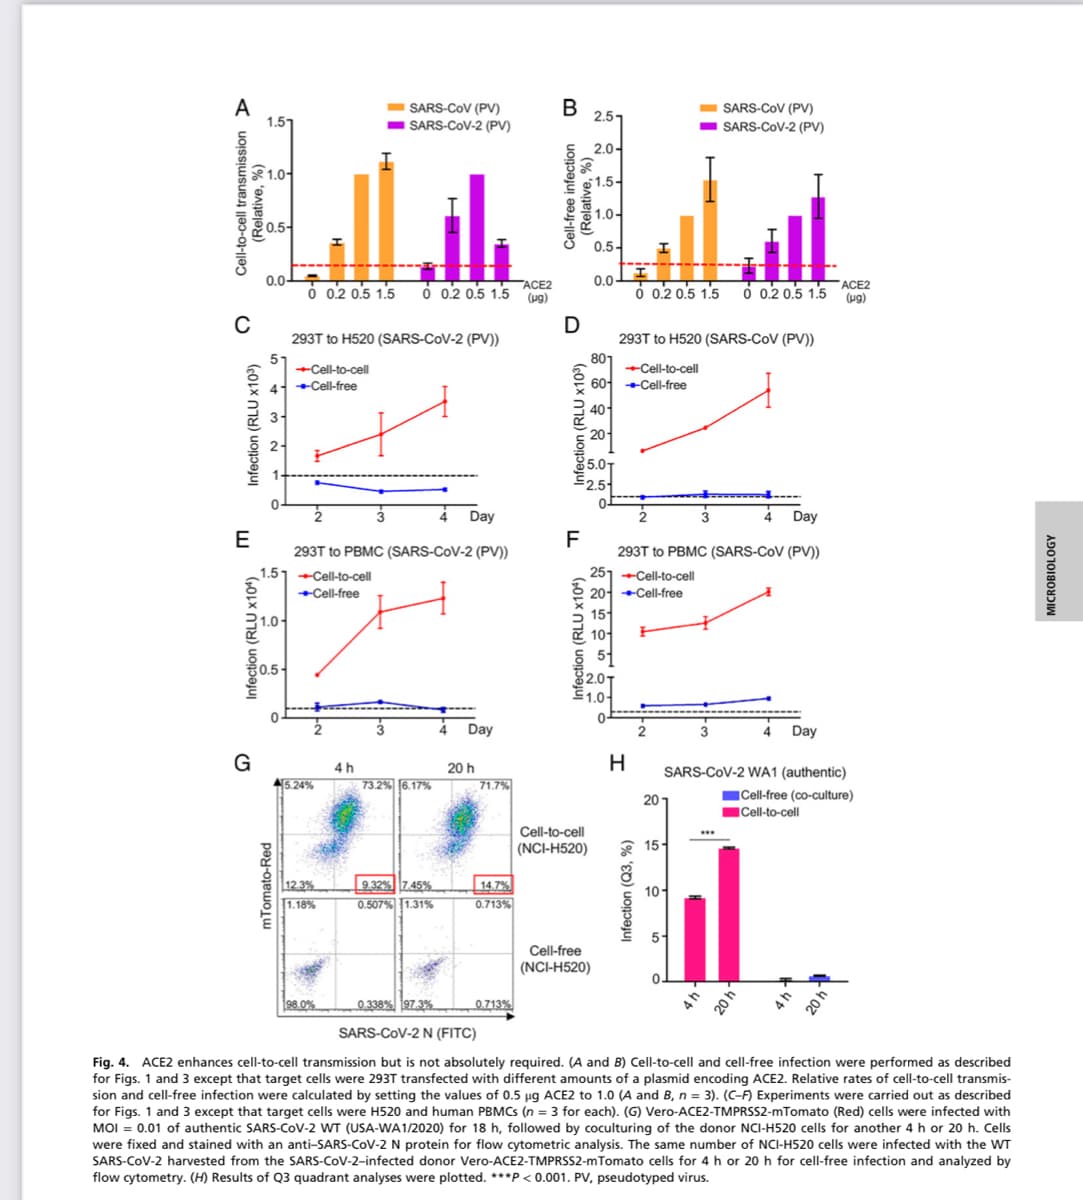
Fig. 4. ACE2 enhances cell-to-cell transmission but is not absolutely required. (A and B) Cell-to-cell and cell-free infection were performed as described
for Figs. 1 and 3 except that target cells were 293T transfected with different amounts of a plasmid encoding ACE2. Relative rates of cell-to-cell transmis-
sion and cell-free infection were calculated by setting the values of 0.5 µg ACE2 to 1.0 (A and B, n = 3). (C-F) Experiments were carried out as described
for Figs. 1 and 3 except that target cells were H520 and human PBMCs (n = 3 for each). (G) Vero-ACE2-TMPRSS2-mTomato (Red) cells were infected with
MOI = 0.01 of authentic SARS-CoV-2 WT (USA-WA1/2020) for 18 h, followed by coculturing of the donor NCI-H520 cells for another 4 h or 20 h. Cells
were fixed and stained with an anti-SARS-CoV-2 N protein for flow cytometric analysis. The same number of NCI-H520 cells were infected with the WT
SARS-CoV-2 harvested from the SARS-CoV-2-infected donor Vero-ACE2-TMPRSS2-mTomato cells for 4 h or 20 h for cell-free infection and analyzed by
flow cytometry. (H) Results of Q3 quadrant analyses were plotted. ***P<0.001. PV, pseudotyped virus.
2.51
2.0-
1.5-
1.0-
0.5-
0.0-
SARS-CoV (PV)
SARS-CoV-2 (PV)
I
푸
ACE2
0 0.2 0.5 1.5 0 0.2 0.5 1.5 (ug)
293T to H520 (SARS-CoV (PV))
2
4
Day
293T to PBMC (SARS-CoV (PV))
…‒‒‒‒‒‒‒‒‒‒‒‒‒‒‒‒‒‒
4 Day
SARS-CoV-2 WA1 (authentic)
Cell-free (co-culture)
Cell-to-cell
***
Infection (RLU x104)
801
→Cell-to-cell
60+Cell-free
40
20-
5.0T
2.5
251 Cell-to-cell
20 →→Cell-free
15
10- F
5-
2.01
드 1.01
0-
H
Infection (Q3, %)
2
20 h
4h
20 h
MICROBIOLOGY
Expert Solution
This question has been solved!
Explore an expertly crafted, step-by-step solution for a thorough understanding of key concepts.

Step by step
Solved in 2 steps

Knowledge Booster


Learn more about
Need a deep-dive on the concept behind this application? Look no further. Learn more about this topic, biology and related others by exploring similar questions and additional content below.Recommended textbooks for you