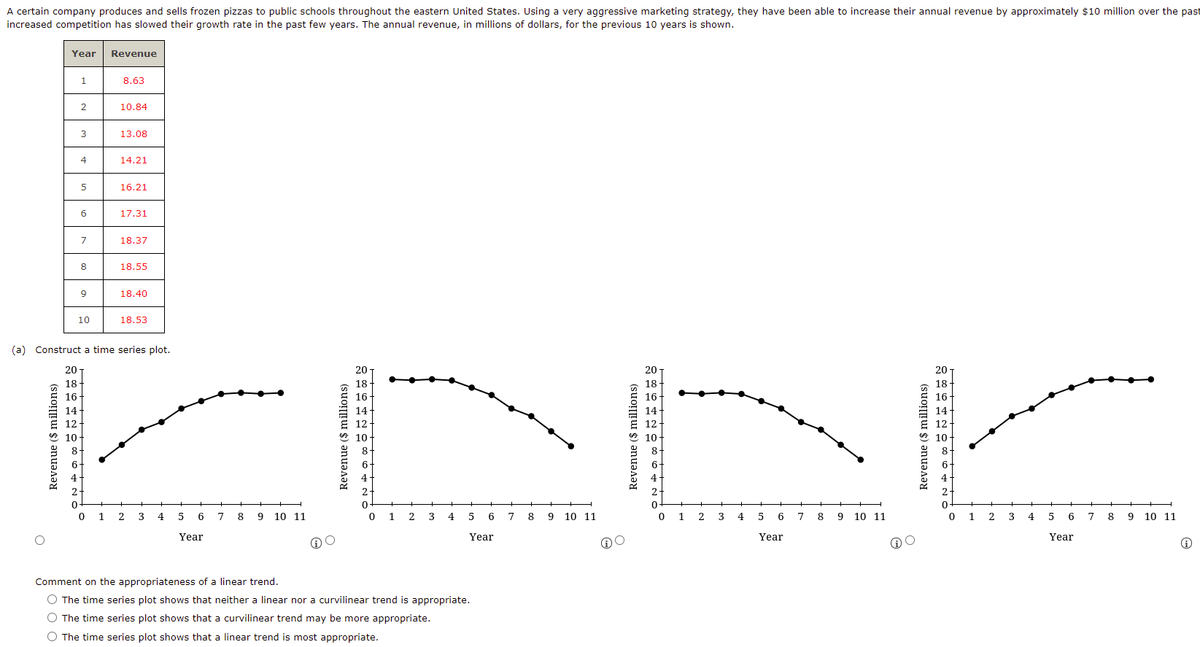
A certain company produces and sells frozen pizzas to public schools throughout the eastern United States. Using a very aggressive marketing strategy, they have been able to increase their annual revenue by approxim increased competition has slowed their growth rate in the past few years. The annual revenue, in millions of dollars, for the previous 10 years is shown. Year Revenue 8.63 2 10.84 13.08 4 14.21 5 16.21 17.31 18.37 18.55 9 18.40 10 18.53
A certain company produces and sells frozen pizzas to public schools throughout the eastern United States. Using a very aggressive marketing strategy, they have been able to increase their annual revenue by approxim increased competition has slowed their growth rate in the past few years. The annual revenue, in millions of dollars, for the previous 10 years is shown. Year Revenue 8.63 2 10.84 13.08 4 14.21 5 16.21 17.31 18.37 18.55 9 18.40 10 18.53

Linear Algebra: A Modern Introduction
4th Edition
ISBN:9781285463247
Author:David Poole
Publisher:David Poole
Chapter4: Eigenvalues And Eigenvectors
Section4.6: Applications And The Perron-frobenius Theorem
Problem 25EQ

Related questions
Question
Transcribed Image Text:A certain company produces and sells frozen pizzas to public schools throughout the eastern United States. Using a very aggressive marketing strategy, they have been able to increase their annual revenue by approximately $10 million over the past
increased competition has slowed their growth rate in the past few years. The annual revenue, in millions of dollars, for the previous 10 years is shown.
Year
Revenue
1
8.63
10.84
13.08
4
14.21
16.21
6.
17.31
7.
18.37
18.55
9
18.40
10
18.53
(a) Construct a time series plot.
20
20
20
20
18
18
18
16-
14-
16
16
14
14
12-
10-
10
10
8
8-
6
4
4-
4
2
2-
2-
1
4
5
7
10 11
2
4
6
7
8
10 11
1
2
3
4
7
8
9
10 11
1
3
4
6
7
8
9
10 11
Year
Year
Year
Year
(i
Comment on the appropriateness of a linear trend.
O The time series plot shows that neither a linear nor a curvilinear trend is appropriate.
O The time series plot shows that a curvilinear trend may be more appropriate.
O The time series plot shows that a linear trend is most appropriate.
Revenue ($ millions)
Revenue ($ millions)
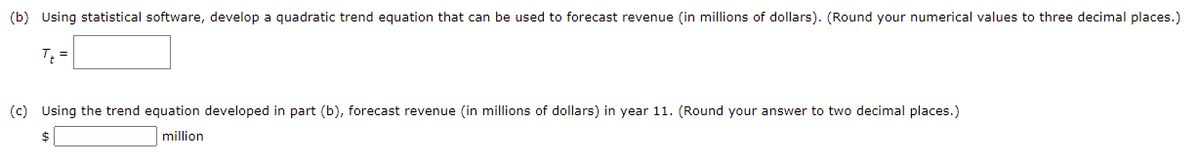
Transcribed Image Text:(b) Using statistical software, develop a quadratic trend equation that can be used to forecast revenue (in millions of dollars). (Round your numerical values to three decimal places.)
(c) Using the trend equation developed in part (b), forecast revenue (in millions of dollars) in year 11. (Round your answer to two decimal places.)
million
Expert Solution
This question has been solved!
Explore an expertly crafted, step-by-step solution for a thorough understanding of key concepts.

This is a popular solution!

Trending now
This is a popular solution!

Step by step
Solved in 2 steps with 1 images

Recommended textbooks for you
Linear Algebra: A Modern Introduction
Algebra
ISBN:
9781285463247
Author:
David Poole
Publisher:
Cengage Learning

Linear Algebra: A Modern Introduction
Algebra
ISBN:
9781285463247
Author:
David Poole
Publisher:
Cengage Learning