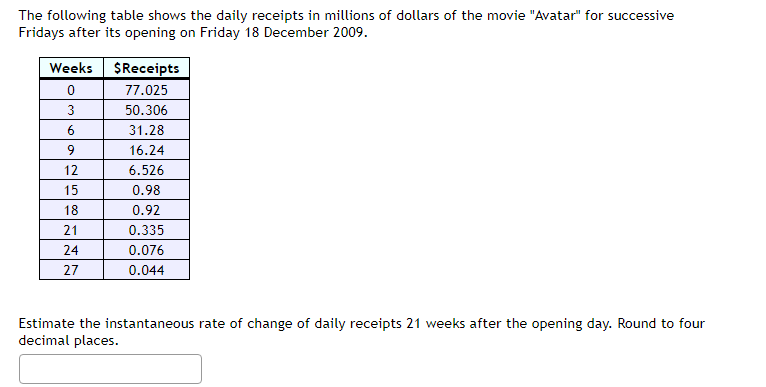
The following table shows the daily receipts in millions of dollars of the movie "Avatar" for successive Fridays after its opening on Friday 18 December 2009. Weeks $Receipts 77.025 3 50.306 6. 31.28 16.24 12 6.526 15 0.98 18 0.92 21 0.335 24 0.076 27 0.044 Estimate the instantaneous rate of change of daily receipts 21 weeks after the opening day. Round to four decimal places.


Q: Using the data in the table to the right, calculate the return for investing in the stock from…
A:
Q: For the Texas Shipping Company, the monthly percentages of all shipments received on time over the…
A: b) MSE for three month moving average = 364.5734/9…
Q: A pharmacist has been monitoring sales of a certain over-the-counter pain reliever. Daily sales…
A: (a). Demand Forecast values for the days 9 through 16 using trend-adjusted exponential smoothing:…
Q: The following table shows the daily receipts in millions of dollars of the movie "Avatar" for…
A:
Q: The following table shows the daily receipts in millions of dollars of the movie "Avatar" for…
A: For x= 23 weeks, a= 20 weeks f(a)= 0.425 and also, b= 26 weeks f(b)= 0.045 Which is the interval of…
Q: The following table shows the daily receipts in millions of dollars of the movie "Avatar" for…
A:
Q: The following table shows the daily receipts in millions of dollars of the movie "Avatar" for…
A: Consider the points 19,0.633,21,0.335,23,0.12,25,0.064 and 27,0.044. Find the Average rate of change…
Q: Consider the following data:Monthly Profit of an Auto Repair Shop Month Jan-14 Feb-14 Mar-14…
A: The exponential smoothing forecast for the next time period (Oct-14) is 19,193.2 and it is…
Q: Demand Predicted 1 132 113 2 192…
A: CALCULTE MAD:
Q: The following table gives the approximate increase in the average price of a movie ticket every two…
A: given that and the price of movie ticket in 2004 is $6.99. we have to find…
Q: The following table reports the percentage of stocks in a portfolio for nine quarters: a. Construct…
A: a) The time series plot obtained using EXCEL is provided below:
Q: The following table shows the daily receipts in millions of dollars of the movie "Avatar" for…
A: Find ablvg slope of two closest points
Q: The following table gives the approximate price increase (in dollars) of a gallon of gas for every…
A: Given that, The following table gives the approximate price increase (in dollars) of a gallon of gas…
Q: The following table shows the percentage of a country's college freshmen in the given year who…
A: Year 1996 2000Percentage 56.7 53.4 Change in percentage =…
Q: consider the following data. Period Rate of Return (%) - 5.8 2 - 7.8 3 -4.0 4 2.0 5.4 What is the…
A: E[x] =∑xp(x)
Q: The following table shows the daily receipts in millions of dollars of the movie "The Hunger Games"…
A:
Q: The following table shows the daily receipts and millions of dollars of the movie avatar for…
A:
Q: The following table shows the daily receipts in millions of dollars of the movie "The Hunger Games"…
A: Given: The given points from the table are: 56, 2.95, 112, 0.279 To find: The average rate of change…
Q: A shop is planning an order for a popular Christmas festive season product. Demand for the product…
A: From the given information, Consider, Demand = X be a random variable. P (X=x) = p, 0< p<1…
Q: The following table gives the number of deaths due to accidental falls for each month during 1970.…
A: Solution: Let us first test whether “Accidents are uniformly distributed”, using a Chi-square test…
Q: The following table shows daily offshore crude oil production by a country's national oil company,…
A:
Q: The following table shows the daily receipts in millions of dollars of the movie "Avatar" for…
A: Given To find the instantaneous rate of change of daily receipts after 11 weeks
Q: 5 Quarterly data from 1960Q1 to 2009Q4, stored in the file consumptn.dat, were used to estimate the…
A:
Q: The following table shows the daily receipts in millions of dollars of the movie "Avatar" for…
A: Given: The daily receipts in millions of dollars of a movie for successive Fridays is given on the…
Q: The following table shows the percentage of a country's college freshmen in the given year who…
A: Given, Year 1996 2000 2004 2008 2012 Percentage 56.3 53.6 53.6 58.5 61.1
Q: The following table shows the daily receipts in millions of dollars of the movie "Avatar for…
A:
Q: The following table shows the daily receipts in millions of dollars of the movie "Avatar" for…
A: Consider the given table.
Q: For the Hawkins Company, the monthly percentages of all shipments received on time over the past 12…
A: Given Data : Month Data 1 80 2 81 3 85 4 83 5 84 6 86 7 85 8 85 9 82 10 81…
Q: The following table shows the daily receipts in millions of dollars of the movie "The Hunger Games"…
A:
Q: The table below shows the number of hours of daylight on the first day of each month in Rochester,…
A: Given, The data for the number of hours of daylight on the first day of each month in Rochester, NY.…
Q: The following table shows the daily receipts in millions of dollars of the movie "Avatar" for…
A:
Q: A shop is planning an order for a popular Christmas festive season product. Demand for the product…
A: From the given information, Consider, Demand = X be a random variable. P (X=x) = p, 0< p<1
Q: The following table shows the daily receipts in millions of dollars of the movie "Avatar" for…
A: Given- The following table shows the daily receipts in millions of dollars of the movie "Avatar" for…
Q: The following table shows the quarterly sales of "Undercover Umbrellas" over a period of two years.…
A: We are given data and the first 4-point moving average
Q: survey as to how long customers claimed to wait in the checkout line until their turn. Let X = time…
A:
Q: A manager of a large workforce wishes to forecast the monthly employee turnover within his…
A: Given information- We have given the turnover data for the last several months is given below-…
Q: The following table shows the daily receipts in millions of dollars of the movie "Avatar" for…
A: Instantaneous rate of change of fx is given byfx+∆x-fx∆x
Q: A shop is planning an order for a popular Christmas festive season product. Demand for the product…
A: From the given information, Consider, Demand = X be a random variable. P (X=x) = p, 0< p<1
Q: The following table shows the daily receipts in millions of dollars of the movie "The Hunger Games"…
A: The table showing the daily receipts in millions of dollars of the movie " The Hunger Games" after…
Q: It is generally known that boys grow at an unusually fast rate between the ages of 12 and 14.…
A: From the given data S.NO. Age 12 Age 14 Difference (d) d^2 1 59.7 65.4 5.7 32.49 2 56.3 61.5…
Q: Calculate the average rate of change of the given function (Inflation(%)) over the interval [1, 4] 5…
A:
Q: The following table shows the daily receipts in millions of dollars of the movie "Avatar" for…
A:
Q: Using simple exponential smoothing and the following time series data, respond to each of the items.…
A: Given data: Period Demand 1 104 2 132 3 143 4 137 5 146 6 150 7 101 8 126 9 116…
Q: The following table shows the daily receipts in millions of dollars of the movie "Avatar" for…
A: Let's find.
Q: The following table shows the daily receipts in millions of dollars of the movie "Avatar" for…
A: The following table shows the daily receipts in millions of dollars of the movie "avatar" for…
Q: Below is a table containing data on product demand for the most recent five months along with the…
A: Given Information Month Demand Forecast 1 308 349.2 2 388 340.9 3 344 350.3 4 400 349.1…
Q: The table below shows percentage changes (x) in the Dow-Jones index over the first five trading days…
A: 1) The correlation coefficient is as follows:
Q: The following table shows the daily receipts in millions of dollars of the movie "The Hunger Games"…
A:
Q: (c) What is the forecast for the next month (in millions of dollars) using exponential smoothing…
A: Data for time series value is given according to months We have to calculate forcast for next month…


Trending now
This is a popular solution!

Step by step
Solved in 2 steps with 2 images

- The manager of a supermarket tracked the amount of time needed for customers to be served by the cashier. After checking with his statistics professor, he concluded that the checkout times are exponentially distributed with a mean of 5 minutes. What propotion of customers require more than 10 minutes to check out?Suppose that historically, the proportion of people who trade in their old car to a car dealer when purchasing a new car is 48%. Over the previous 6 months, in a sample of 115 new-car buyers, 46 have traded in their old car. To determine whether the proportion of new car buyers that trade in their old car has statistically significantly decreased, what is the p-value? (please round your answer to 4 decimal places)The survival curve below was constructed from a study that followed 7 individuals being treated with prednisone for inflammatory conditions over a period of 8 months. Assuming the event described is the point in time the individuals developed prednisone-induced hypertension and those individuals who made it to 8 months concluded the study without prednisone-induced hypertension, calculate and interpret the proportion of individuals who suffered from prednisone-induced hypertension at the end of the study. A) 14.3% of individuals in the study did not develop prednisone-induced hypertension. B) 14.3% of individuals in the study did not develop prednisone-induced hypertension during the time frame in which the study was being conducted. C) 85.7% of individuals in the study did not develop prednisone-induced hypertension. D) 85.7% of individuals in the study did not develop prednisone-induced hypertension during the time frame in which the study was being conducted.
- If the lead time increases from 1 to 4 weeks, will the standard deviation of demand during thelead time increase four times? If not, why not?Assume that the time it takes for bacterial growth on a dairy product after it is taken out of fridge follows an Exponential distribution with a mean of 10 minutes. What is the probability that bacterial growth will not happen in 15 minutes if the dairy product has already been out of the fridge for 10 minutes?Suppose that historically, the proportion of people who trade in their old car to a car dealer when purchasing a new car is 48%. Over the previous six months, in a sample of 115 new car buyers, 46 have traded in their old car. To determine whether the proportion of new car buyers that trade in their old car has  statistically significantly decreased, what is the P value? (please round your answer to four decimal places)
- Suppose that the length of long distance phone calls, mea- sured in minutes, is known to have an exponential distribution with the average length of a call equal to 15 minutes. Find the CDF.Your flight is scheduled to arrive in TPA at 10:05pm. You have estimated that the time from arrival for you to deplane, get across the airport, collect your checked bags, and make it to the train station is well described by an exponential distribution with mean 40 minutes. If the last train leaves at 11:00pm, what is the probability that you make it to the train on time if your plane arrives 10 minutes late?Suppose the linear relationship between traffic violations and auto insurance premium has SSR of 2825 and SST of 3150. What percent of the insurance premium is unexplained by traffic violation?
- Historically, the proportion of people who trade in their old car to a car dealer when purchasing a new car is 48%. Over the previous six months, in a sample of 115 new car buyers, 46 have traded in their old car. To determine (at the 10% level of significance) whether the proportion of new car buyers that trade in their old car has this is sickly significantly decreased, what is the test statistic? (please round your answer to two decimal places)Historically, the proportion of people who trade in their old car to a car dealer when purchasing a new car is 52%. Over the previous 4 months, in a sample of 115 new-car buyers, 59 have traded in their old car. To determine (at the 10% level of significance) whether the proportion of new-car buyers that trade in their old car has statistically significantly decreased, what is the test statistic? (please round your answer to 2 decimal places)The following table shows predicted product demand using your particular forecasting method along with the actual demand that occurred: FORECAST ACTUAL 1,515 1,585 1,415 1,515 1,715 1,615 1,755 1,680 1,805 1,730 Compute the tracking signal using the mean absolute deviation and running sum of forecast errors.