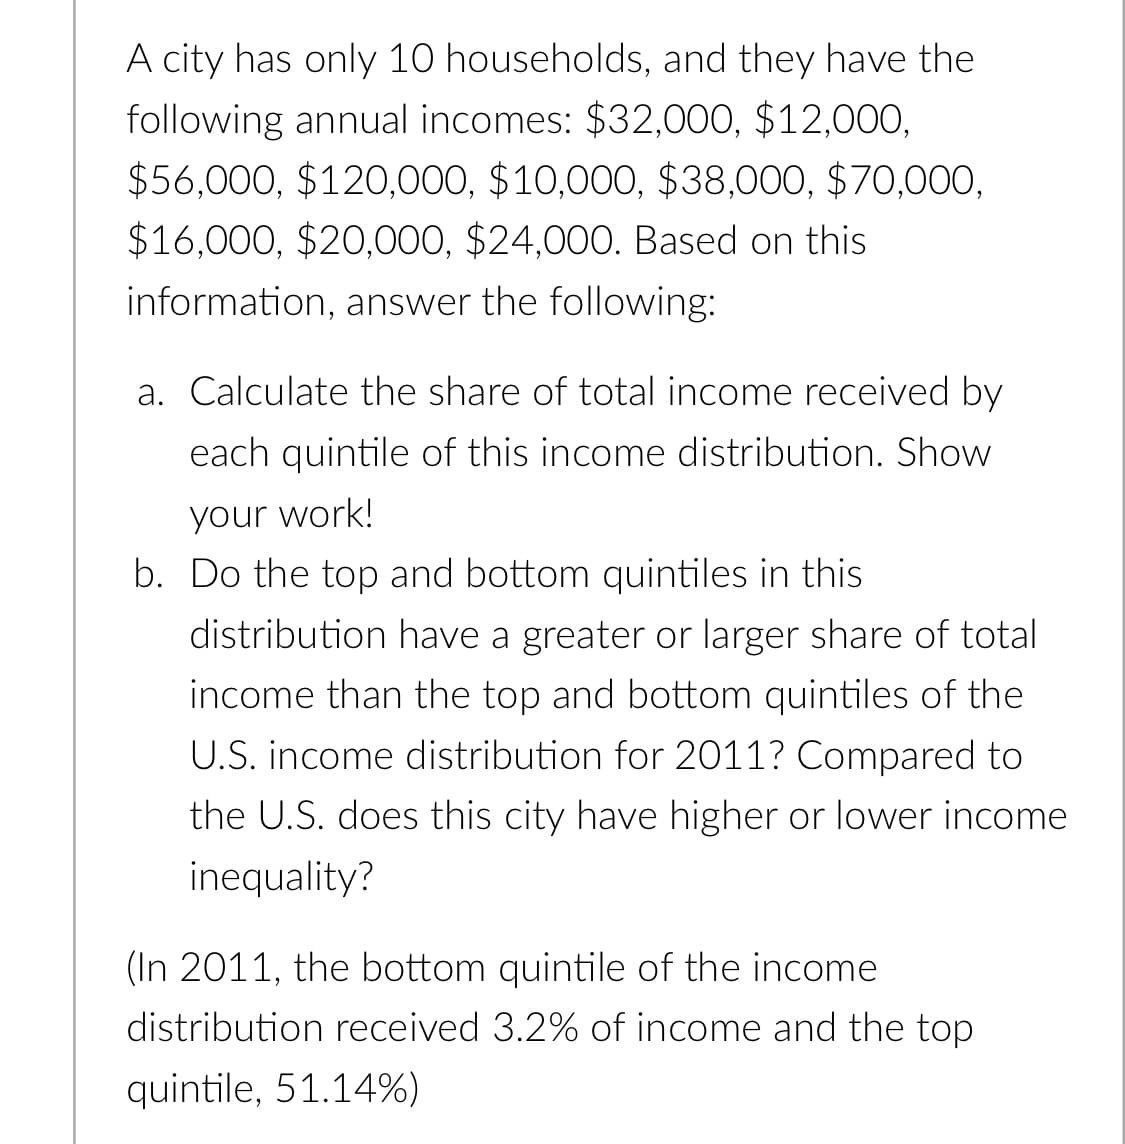
A city has only 10 households, and they have the following annual incomes: $32,000, $12,00O, $56,000, $120,000, $10,000, $38,000, $70,000, $16,000, $20,000, $24,000. Based on this information, answer the following: a. Calculate the share of total income received by each quintile of this income distribution. Show your work! b. Do the top and bottom quintiles in this distribution have a greater or larger share of total income than the top and bottom quintiles of the U.S. income distribution for 2011? Compared to the U.S. does this city have higher or lower income inequality? (In 2011, the bottom quintile of the income distribution received 3.2% of income and the top quintile, 51.14%)
A city has only 10 households, and they have the following annual incomes: $32,000, $12,00O, $56,000, $120,000, $10,000, $38,000, $70,000, $16,000, $20,000, $24,000. Based on this information, answer the following: a. Calculate the share of total income received by each quintile of this income distribution. Show your work! b. Do the top and bottom quintiles in this distribution have a greater or larger share of total income than the top and bottom quintiles of the U.S. income distribution for 2011? Compared to the U.S. does this city have higher or lower income inequality? (In 2011, the bottom quintile of the income distribution received 3.2% of income and the top quintile, 51.14%)

MATLAB: An Introduction with Applications
6th Edition
ISBN:9781119256830
Author:Amos Gilat
Publisher:Amos Gilat
Chapter1: Starting With Matlab
Section: Chapter Questions
Problem 1P

Related questions
Question
Transcribed Image Text:A city has only 10 households, and they have the
following annual incomes: $32,000, $12,000,
$56,000, $120,000, $10,000, $38,000, $70,000,
$16,000, $20,000, $24,000. Based on this
information, answer the following:
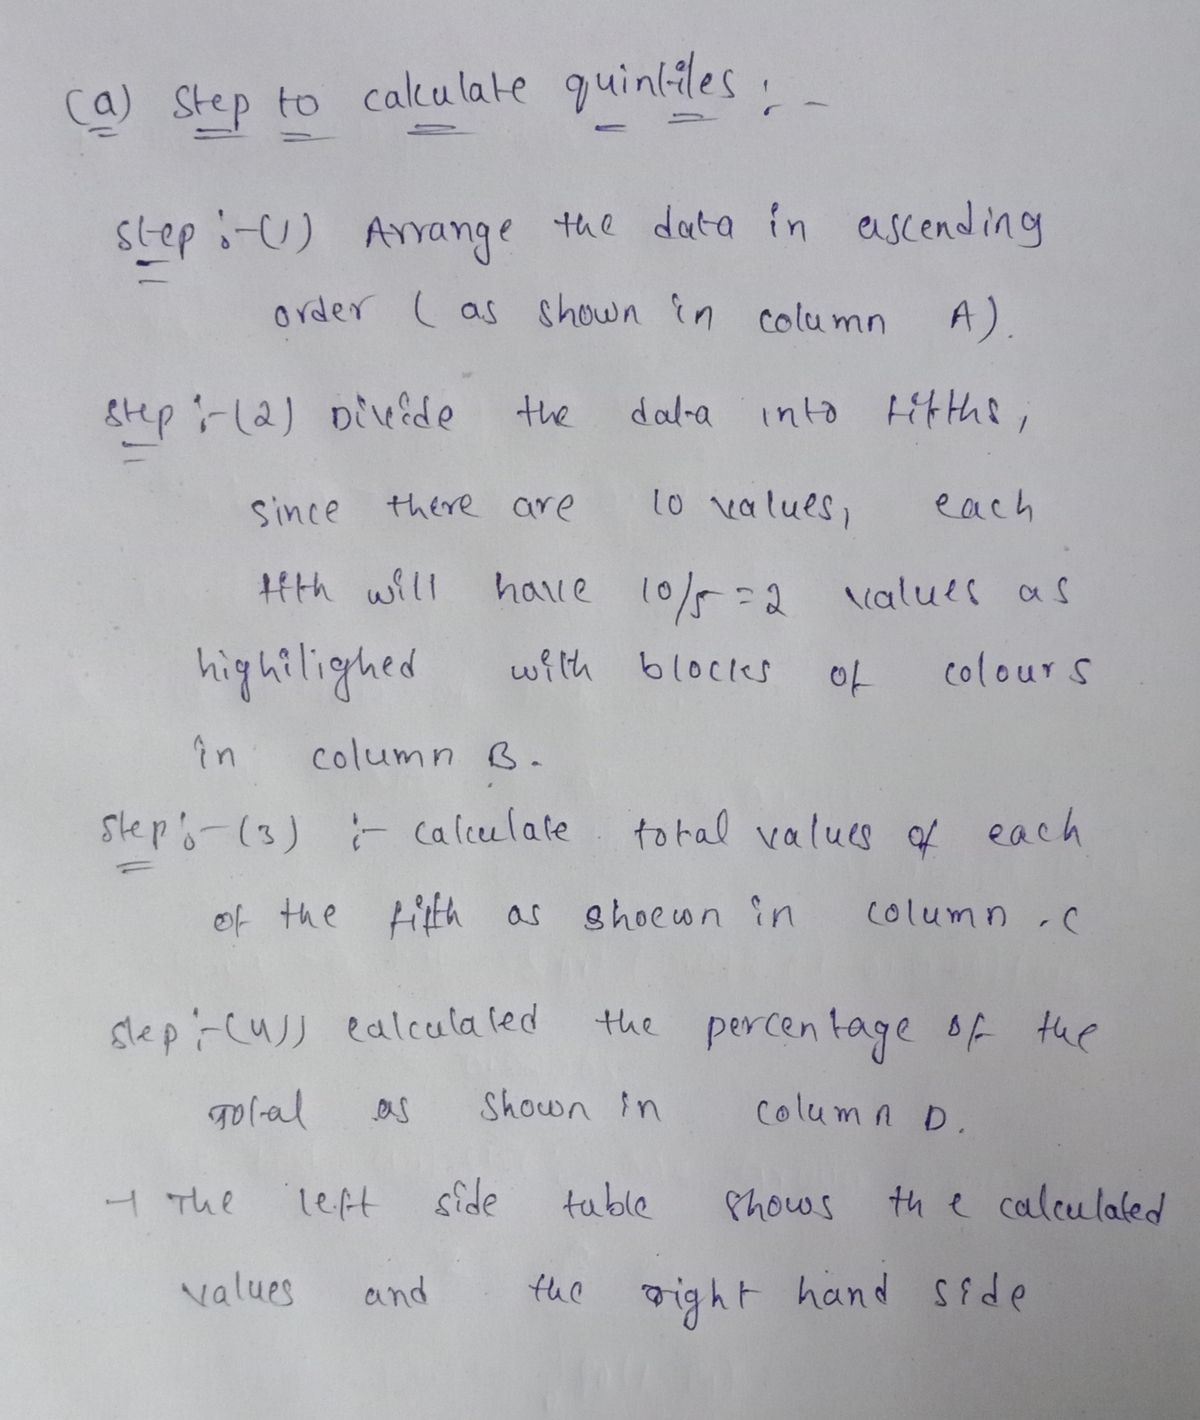
a. Calculate the share of total income received by
each quintile of this income distribution. Show
your work!
b. Do the top and bottom quintiles in this
distribution have a greater or larger share of total
income than the top and bottom quintiles of the
U.S. income distribution for 2011? Compared to
the U.S. does this city have higher or lower income
inequality?
(In 2011, the bottom quintile of the income
distribution received 3.2% of income and the top
quintile, 51.14%)
Expert Solution
Step 1

Trending now
This is a popular solution!

Step by step
Solved in 5 steps with 5 images

Recommended textbooks for you
MATLAB: An Introduction with Applications
Statistics
ISBN:
9781119256830
Author:
Amos Gilat
Publisher:
John Wiley & Sons Inc

Probability and Statistics for Engineering and th…
Statistics
ISBN:
9781305251809
Author:
Jay L. Devore
Publisher:
Cengage Learning

Statistics for The Behavioral Sciences (MindTap C…
Statistics
ISBN:
9781305504912
Author:
Frederick J Gravetter, Larry B. Wallnau
Publisher:
Cengage Learning
MATLAB: An Introduction with Applications
Statistics
ISBN:
9781119256830
Author:
Amos Gilat
Publisher:
John Wiley & Sons Inc
Probability and Statistics for Engineering and th…
Statistics
ISBN:
9781305251809
Author:
Jay L. Devore
Publisher:
Cengage Learning
Statistics for The Behavioral Sciences (MindTap C…
Statistics
ISBN:
9781305504912
Author:
Frederick J Gravetter, Larry B. Wallnau
Publisher:
Cengage Learning

Elementary Statistics: Picturing the World (7th E…
Statistics
ISBN:
9780134683416
Author:
Ron Larson, Betsy Farber
Publisher:
PEARSON

The Basic Practice of Statistics
Statistics
ISBN:
9781319042578
Author:
David S. Moore, William I. Notz, Michael A. Fligner
Publisher:
W. H. Freeman

Introduction to the Practice of Statistics
Statistics
ISBN:
9781319013387
Author:
David S. Moore, George P. McCabe, Bruce A. Craig
Publisher:
W. H. Freeman