A company wants to determine whether its consumer produc ungs (0- 10) have changed from last year to this year. The t able below shows the company's product ratings from eight consumers for last year and this year. At d= there enough evidence to conciude that the ratings have changed? Assume the samples are random and dependent, and the population is normally distributed. Complete parts (a) through (1). Consumer Rating (last year) Rating (this year) 6 4 4 1 2 3 4 5 5 6 5 5 4 4 78 0 6 5 9 7 3 6 8 9 (a) Identify the claim and state H, and Hg The claim is "The product ratings have V from last year to this year." Let Hg be the hypothesized mean of the ratings last year minus the ratings this year. State H, and H. Choose the correct answer below. O A. Họ: Ha #0 H P =0 O B. Ho: Hg 20 OC. Họ: Hg =0 H Hg #0 OD. H Pa s0 OE H e zd OF. Ho Ha sa (b) Find the critical value(s) and identify the rejection region(s). (Use a comma to separate answers as needed. Type an integer or a decimal. Round to three decimal places as needed.) Identify the rejection region. Choose the correct answer below. O A. t< -2.365, t>2.365 O B. t< -2.365 OC. t< -1.895, t> 1.895
A company wants to determine whether its consumer produc ungs (0- 10) have changed from last year to this year. The t able below shows the company's product ratings from eight consumers for last year and this year. At d= there enough evidence to conciude that the ratings have changed? Assume the samples are random and dependent, and the population is normally distributed. Complete parts (a) through (1). Consumer Rating (last year) Rating (this year) 6 4 4 1 2 3 4 5 5 6 5 5 4 4 78 0 6 5 9 7 3 6 8 9 (a) Identify the claim and state H, and Hg The claim is "The product ratings have V from last year to this year." Let Hg be the hypothesized mean of the ratings last year minus the ratings this year. State H, and H. Choose the correct answer below. O A. Họ: Ha #0 H P =0 O B. Ho: Hg 20 OC. Họ: Hg =0 H Hg #0 OD. H Pa s0 OE H e zd OF. Ho Ha sa (b) Find the critical value(s) and identify the rejection region(s). (Use a comma to separate answers as needed. Type an integer or a decimal. Round to three decimal places as needed.) Identify the rejection region. Choose the correct answer below. O A. t< -2.365, t>2.365 O B. t< -2.365 OC. t< -1.895, t> 1.895

MATLAB: An Introduction with Applications
6th Edition
ISBN:9781119256830
Author:Amos Gilat
Publisher:Amos Gilat
Chapter1: Starting With Matlab
Section: Chapter Questions
Problem 1P

Related questions
Question
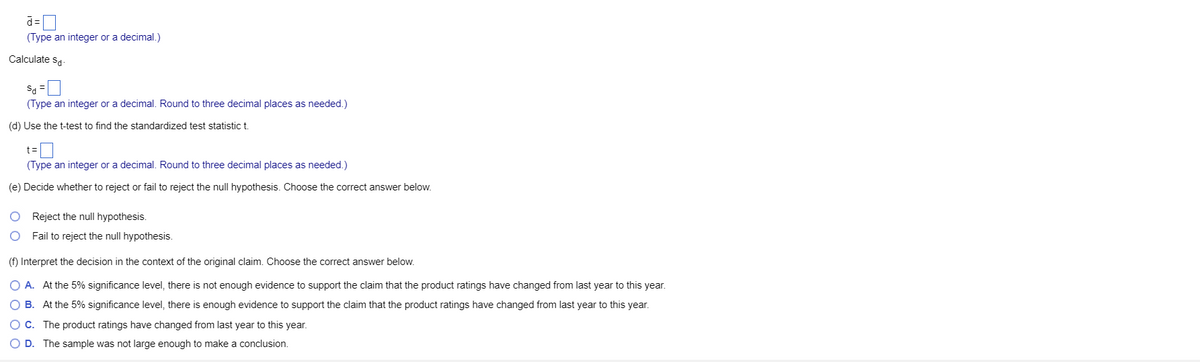
Transcribed Image Text:d =
(Type an integer or a decimal.)
Calculate sa-
Sa =
(Type an integer or a decimal. Round to three decimal places as needed.)
(d) Use the t-test to find the standardized test statistic t.
t3D
(Type an integer or a decimal. Round to three decimal places as needed.)
(e) Decide whether to reject or fail to reject the null hypothesis. Choose the correct answer below.
Reject the null hypothesis.
Fail to reject the null hypothesis.
(f) Interpret the decision in the context of the original claim. Choose the correct answer below.
A. At the 5% significance level, there is not enough evidence to support the claim that the product ratings have changed from last year to this year.
O B. At the 5% significance level, there is enough evidence to support the claim that the product ratings have changed from last year to this year.
O C. The product ratings have changed from last year to this year.
O D. The sample was not large enough to make a conclusion.
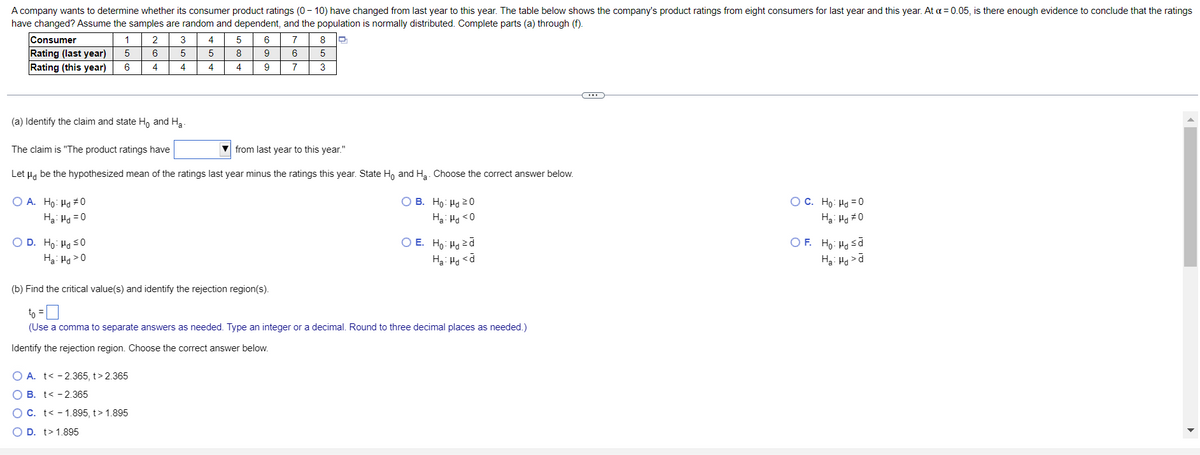
Transcribed Image Text:A company wants to determine whether its consumer product ratings (0 - 10) have changed from last year to this year. The table below shows the company's product ratings from eight consumers for last year and this year. At a = 0.05, is there enough evidence to conclude that the ratings
have changed? Assume the samples are random and dependent, and the population is normally distributed. Complete parts (a) through (f).
Consumer
Rating (last year)
Rating (this year)
2
3
5
6
7
8
5
6.
8
6.
4
4
4
4
9
3
(a) Identify the claim and state H, and Ha.
The claim is "The product ratings have
from last year to this year."
Let Hg be the hypothesized mean of the ratings last year minus the ratings this year. State H, and Ha. Choose the correct answer below.
O A. Ho: Ha # 0
O B. Ho: Hd 2 0
OC. Ho: Ha = 0
Ha: Ha = 0
Hạ: Ha <0
Ha: Ha #0
O D. Ho: Ha s0
Ha: Ha >0
O E. Ho: Ha zd
Ha: Ho <d
O F. Ho: Ha sd
(b) Find the critical value(s) and identify the rejection region(s).
to = O
(Use a comma to separate answers as needed. Type an integer or a decimal. Round to three decimal places as needed.)
Identify the rejection region. Choose the correct answer below.
O A. t< - 2.365, t> 2.365
B. t< - 2.365
O C. t< - 1.895, t> 1.895
O D. t>1.895
Expert Solution
This question has been solved!
Explore an expertly crafted, step-by-step solution for a thorough understanding of key concepts.

This is a popular solution!

Trending now
This is a popular solution!

Step by step
Solved in 2 steps with 1 images

Recommended textbooks for you
MATLAB: An Introduction with Applications
Statistics
ISBN:
9781119256830
Author:
Amos Gilat
Publisher:
John Wiley & Sons Inc

Probability and Statistics for Engineering and th…
Statistics
ISBN:
9781305251809
Author:
Jay L. Devore
Publisher:
Cengage Learning

Statistics for The Behavioral Sciences (MindTap C…
Statistics
ISBN:
9781305504912
Author:
Frederick J Gravetter, Larry B. Wallnau
Publisher:
Cengage Learning
MATLAB: An Introduction with Applications
Statistics
ISBN:
9781119256830
Author:
Amos Gilat
Publisher:
John Wiley & Sons Inc
Probability and Statistics for Engineering and th…
Statistics
ISBN:
9781305251809
Author:
Jay L. Devore
Publisher:
Cengage Learning
Statistics for The Behavioral Sciences (MindTap C…
Statistics
ISBN:
9781305504912
Author:
Frederick J Gravetter, Larry B. Wallnau
Publisher:
Cengage Learning

Elementary Statistics: Picturing the World (7th E…
Statistics
ISBN:
9780134683416
Author:
Ron Larson, Betsy Farber
Publisher:
PEARSON

The Basic Practice of Statistics
Statistics
ISBN:
9781319042578
Author:
David S. Moore, William I. Notz, Michael A. Fligner
Publisher:
W. H. Freeman

Introduction to the Practice of Statistics
Statistics
ISBN:
9781319013387
Author:
David S. Moore, George P. McCabe, Bruce A. Craig
Publisher:
W. H. Freeman