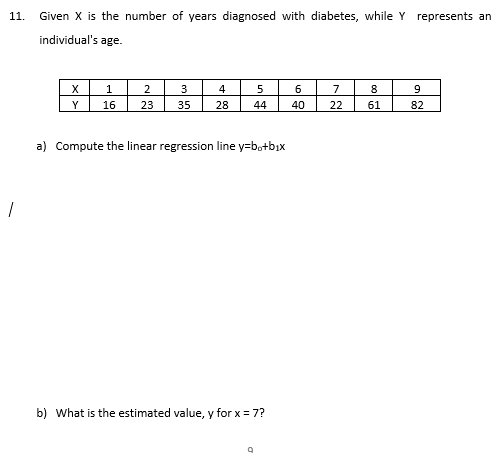
a) Compute the linear regression line y=bo+b₁x b) What is the estimated value, y for x = 7?


Q: What is the median weight of college students?
A: Given: Weight Frequency 40-44 1 45-49 14 50-54 15 55-59 21 60-64 14 65-69 10 70-74…
Q: Let x be a continuous random variable that has a normal distribution with u = 50 and a = 8. Find the…
A:
Q: Consider the Gamma distribution, with parameters α and λ. Compute the hazard function of a Gamma…
A:
Q: 4.11 Age and Sleep The scatterplot shows the age and number of hours of sleep "last night" for some…
A: Given that: Scatterplot of Age vs Hours of sleep is provided. Correlation describes the degree to…
Q: X P(x) 0 0.3 1 1 0.2 2 0.2 3 0.3 Find the standard deviation of this probability distribution. Give…
A: V(x)=E(x^2)-E(x)
Q: 1: Which statement is incorrect? A. B. C. D. A random variable may take on any value. A continuous…
A: Statistics
Q: A researcher is interested in finding a 90% confidence interval for the mean number minutes students…
A: From the provided information, Sample size (n) = 119 Mean (x̄) = 33.3 Population standard deviation…
Q: Lombard Electronics Company has just installed a new machine that makes a part that is used in…
A:
Q: More 10th grade students were surveyed than 9th grade students. A total of 221 students were…
A:
Q: A psychologist would like to examine the effects of a new drug on the activity level of animals.…
A: Null hypothesis: H0:µ1 = µ2 = µ3 Alternative hypothesis: H1: At least one of the means is different…
Q: Find the Value of t for a t-distrubution with 16 degrees of freedom such that the area to the left…
A: t distribution is symmetric about t=0 Here degree of freedom 'n' is 16 For finding t value of t…
Q: 24. Twenty students, selected at random were asked to estimate the number of hours that they had…
A:
Q: A group of students wants to check whether there is an association between the satisfaction level of…
A: a) Hypotheses: Null hypothesis: There is no association between the satisfaction level and gender of…
Q: d to be credited back as this answer is incomplete and incor
A: Given: Population mean μ=169 Population standard deviation σ=72.9 Sample size (n) = 10
Q: ased on the data shown below, calculate the regression line (each value to at least two decimal…
A: Regression analysis is a mathematical measure of the average relationship between two or more…
Q: A newsgroup is interested in constructing a 95% confidence interval for the proportion of all…
A: Here, the confidence level is 0.95. Thus, α=0.05=1-0.95. Using Excel formula…
Q: Is the average time to complete an obstacle course longer when a patch is placed over the right eye…
A:
Q: The following frequency table summarizes 60 data values. What is the 3rd quartile of the data?…
A: Given Data Value 1 2 3 4 5 6 7 8 9 10 11 12 13 14 15 16 17 18 19 20 Frequency 5 4 3 1 6…
Q: how many Ways can 7 new members be chosen is 5 or more must be from the senior class
A: It is given that Students from junior class = 7 Students from senior class = 8 Combination…
Q: 5) People were asked if they prefer Pepsi or Coke. The results are in the table below. Female Male…
A: ( a ) P( both prefer Pepsi) = ? ( b ) P( Female or Coke ) = ?
Q: Please make own problem with complete solution. You may get from the internet but modify the problem…
A: The following is the example of the point estimation.
Q: J 2 June 2011 Pew Research Center study reported that "On average, Facebook users receive more…
A: Data analysis and research
Q: c) In choice situations of this type, subjects often exhibit the "center stage effect," which is a…
A: With respect to previous parts, The distribution of number of subjects among 100 participants who…
Q: Weight (in kg) 40-44 45-49 50-54 55-59 60-64 65-69 70-74 75-79 Frequency 1 14 15 21 14 10 4 1
A: The given data is Weight(in kg) Frequency 40-44 1 45-49 14 50-54 15 55-59 21 60-64 14…
Q: The following output models the factors that influence the price of a particular good. Calculate the…
A: Since you have asked multiple question, we will solve the first question for you. If youwant any…
Q: A random sample of size 100 is taken from a normal distribution population with sigmma=5.3 . give…
A:
Q: Stem Leaves 41 0123678 42 0135789 43 015679 44 006888 45 2237899 The value of the 26th percentile…
A:
Q: To compute the confidence interval use a distribution. b. With 95% confidence the population mean…
A: It is given that The data in discrete form of size 11 is 15 12 9 25 20 9 6 10 7 26 27
Q: 7.64 Historically, 93% of the deliveries of an overnight mail service arrive before 10:30 the…
A:
Q: Attendance at Orlando's newest Disneylike attraction, Lego World, has been as follows: Guests (in…
A: Average demand(WINTER)=58+63+99/3 =220/3…
Q: A regression was run to determine if there is a relationship between hours of TV watched per day (x)…
A: Given: Regression line: y = ax + b a = -0.889 b = 32.071 r^2=0.505521 r = -0.606
Q: Find the 20%20% trimmed mean of the following data. If necessary, round to one more decimal place…
A: Given data is 29, 33, 37, 39, 40, 41, 42, 43, 43, 44, 45, 47, 48, 49, 52, 53, 54, 54, 55, 60 n=Total…
Q: A The regression equation is Y = i + i
A: Use the Excel and Perform the Regression. Followings are the Steps to perform the Regression 1) Open…
Q: X P(x) 0 0.05 1 0.3 2 0.15 3 0.5 ind the standard deviation of this probability distribution. Give…
A: The given data is X P(X) 0 0.05 1 0.3 2 0.15 3 0.5
Q: state are µ=$13,525 and o-$4,180, respectively. Suppose random samples of 100 are drawn from the…
A: A random sample of size 100 is drawn; n=100 The mean and standard deviation of vehicles is…
Q: Let X and Y be two random variables and let r, s, t, and u be real numbers. a. Show that Cov(X+s,…
A: Given: X and Y be two random variables and let r, s, t, and u be real numbers. We have to show that…
Q: Use the sample information below and the t-distribution to find a 90% confidence interval for the…
A: According to the given information in this question We need to find 90% confidence interval
Q: A population of values has a normal distribution with μ=169μ=169 and σ=72.9σ=72.9. You intend to…
A: According to the given information in this question We need to find the z score for two parts
Q: In this problem, we explore the effect on the standard deviation of adding the same constant to each…
A:
Q: A box contains 10 Red balls and 5 Blue balls. A person has been assigned to transfer 4 balls at…
A: Probability
Q: In a test of the effectiveness of garlic for lowering cholesterol, 47 subjects were treated with…
A:
Q: Question 2 A natural wellness and beauty company claims that, on average, their new product. lowers…
A: Part I Obtain the missing values in the table. The missing values in the table are obtained below as…
Q: (a) Two independent random variables X, Y have zero mean, and variance 3, 6 respectively. Estimate…
A: Note: As per the guidelines, we are solving first question for you. Kindly re post the question and…
Q: If n=41, ¯x=39, and s=16, construct a confidence interval at a 99% confidence level. Assume the data…
A: Given that Sample size (n) = 41 Sample mean (x¯) = 39 Sample standard deviation (s) = 16 Confidence…
Q: If, in a sample of n=20 selected from a normal population, X=53 and S=8, what are the…
A:
Q: 12) The distributions of income in the United States is strongly skewed to the right. Which of the…
A:
Q: Mars, Inc. states that 16% of all milk chocolate M&M’S® produced are green. A group of students took…
A: 1)Given20 samples of M&Ms with sample size 3020 samples of M&Ms with sample size 60. To…
Q: Determine whether to reject Ho. (b) Since the test statistic, z=2.30, (Choose one) ▼ in the critical…
A: Given: Null and alternate hypotheses H0 : µ = 18H1: µ ≠ 18 At 10% Zcritical = ( -1.645 and 1.645…
Q: c) Obtain the distribution function Fx (x) for this random variable d) Find P{0.2 ≤ x ≤ 0.6}
A:
Q: Question 2 A manufacturing company want to compare the yield from two engineering process. The…
A: Given data: Good Bad Total Process A 86 14 100 Process B 80 20 100 Total 166 34 200

Step by step
Solved in 2 steps

- A “Cobb–Douglas” production function relates production (Q) to factorsof production, capital (K), labor (L), and raw materials (M), and an errorterm u using the equation Q = λKβ1Lβ2Mβ3eu, where λ, β1, β2, and β3 areproduction parameters. Suppose that you have data on production and thefactors of production from a random sample of firms with the same Cobb–Douglas production function. How would you use regression analysis toestimate the production parameters?1. Suppose that the sales of a company (Y) is regressed on advertising expenditure (x) and labor cost (z), and the estimated regression equation is Y = 5 + 0.5x + 0.7z + u (where u is the error term). Here, sales, advertising expenditure and labor cost are measured in million Tk. Standard error for the coefficient of x is 0.4, standard error for the coefficient of z is 0.01, and the sample size is 20. Based on this information, find out whether labor cost is a statistically significant variable using an appropriate statistical test.23. Compute the actual values indicated by A,B,C and D in that order. A. 2569, 560, 996553, 87103 B. 996553, 2569, 87103, 560 C. 650, 632699, 18730, 9562 D. 2695, 650, 633599, 17830 24. If the general linear regression model is given by the equation: y=a+bx; considering the information obtained in figure 2, compute the value of b. A. 210.185 B. 121.852 C. 21.850 D. 2.185 25. If the general linear regression model is given by the equation: y=a+bx; considering the information obtained in figure 2, compute the value of a. A. 397.210 B. 973.102 C. 210. 379 D. 237.021
- Consider the following simple linear regression model: y = β0 + β1x + u. Using a sample of n observations on x and y, you estimate the model by OLS and obtain the estimates βˆ 0, βˆ 1, and the R-squared of the regression, R2 . Then you scale this sample by a factor of 100, obtain a new sample {xi/100; yi/100} for i = 1, . . . , n, re-estimate the model by OLS, and denote the new coefficient estimates by β˜ 0, β˜ 1, and the new R-squared of the regression by R˜2 . a) Give the expression of β˜ 1 in terms of βˆ 1, and justify your answer.Consider the following regression model Yt = β0 + β1 Ut + β2 Vt + β3 Wt + β4Xt + ∈t , where U, V, W, X and Y are economic variables observed from t = 1, . . . , 75, β0 , . . . , β4 are the model parameters and ∈t is the random disturbance term satisfying the classical assumptions. Ordinary Least Squares (OLS) is used to estimate the parameters, producing the following estimated model: Yt = 1.115 + 0.790*Ut − 0.327*Vt + 0.763*Wt + 0.456*Xt (0.405) (0.178) (0.088) (0.274) (0.017) where standard errors are given in parentheses, the R-squared = 0.941, the Durbin-Watson statistic is DW = 1.907 and the residual sum of squares is RSS = 0.0757. In answering this question, use the 5% level of significance for any hypothesis tests that you are asked to perform, state clearly the null and al- ternative hypotheses that you are testing, the test statistics that you are using and interpret the decisions that you make.…The table below shows the number of state-registered automatic weapons and the murder rate for several Northwestern states, where xx is thousands of automatic weapons and yy is murders per 100,000 residents. xx 11.5 8.5 6.7 3.5 2.9 2.7 2.7 0.9 yy 14.1 11 10 7.3 6.7 6.4 6.4 4.7 Use your calculator to determine the equation of the regression line and write it in the y=ax+by=ax+b form. Round to 2 decimal places. According to this model, how many murders per 100,000 residents can be expected in a state with 10.2 thousand automatic weapons? Round to 3 decimal places. According to this model, how many murders per 100,000 residents can be expected in a state with 5.8 thousand automatic weapons? Round to 3 decimal places.
- The following table gives the marks obtained by 10 students in POLI 344 (X) together with the marks obtained in the exam in POLI 308 (Y). POLI 344 (X)8 8 9 10 10 11 12 13 13 11 14 POLI 443 (Y) 7 11 8 7 12 11 10 12 14 17 15 (i) State the two equation lines of the regression line. (ii) If a student was absent from POLI 443 but scored 18 in POLI 344 (X) state the regression line, which would be suitable for estimating his/her possible mark in POLI 443 and work out a fair estimate for his /her possible mark.31 - Find the regression model. Regresyon modelini bulunuz. Y X 2 5 5 9 7 4 4 11A) y=-3,21+2,11xB) y=2,56+5,43xC) y=5,27+0,11xSuppose a researcher, using wage data on 200 randomly selected maleworkers and 240 female workers, estimates the OLS regression ''Wage'' = 10.73 + 1.78 X Male, R2 = 0.09, SER = 3.8, (0.16) (0.29)where Wage is measured in dollars per hour and Male is a binary variablethat is equal to 1 if the person is a male and 0 if the person is a female.Define the wage-gender gap as the difference in mean earnings betweenmen and women.a. What is the estimated gender gap?b. Is the estimated gender gap significantly different from 0? (Computethe p-value for testing the null hypothesis that there is no gender gap.)c. Construct a 95% confidence interval for the gender gap.d. In the sample, what is the mean wage of women? What is the meanwage of men?e. Another researcher uses these same data but regresses Wages on Female, a variable that is equal to 1 if the person is female and 0 if the person is male. What are the regression estimates calculated from this regression?"Wage" =______ +________ X Female,…
- For these (x,y) pairs of data points: 1,5 3,7 4,6 5,8 7,9 Compute . Compute . What is the equation of the regression line?Use the following results obtained from a simple linear regression analysis with 12 observations. Y = 37.2895- (1.2024)X Sb = 0.2934 Test to determine if there is a significant negative relationship between the independent and dependent variables at alpha= .05. Give the resulting conclusion. a. is rejected. B.cannot be tested with the given information. c. is not rejected. D. is not an appropriate null hypothesis for this situation.A researcher would like to predict the dependent variable YY from the two independent variables X1X1 and X2X2 for a sample of N=11N=11 subjects. Use multiple linear regression to calculate the coefficient of multiple determination and test statistics to assess the significance of the regression model and partial slopes. Use a significance level α=0.05α=0.05. X1X1 X2X2 YY 52.3 45.6 49.1 55.9 48.7 53.1 46.5 47.4 45.9 52 45.6 59.8 48.9 45.5 52.6 46.2 35.1 71.2 28.8 32.6 33.5 40.7 41 40.3 43.7 40 65.8 47 37.8 52.8 34.2 28 53.5 R2=R2= (Not the adjusted R2R2) FF test statistic = P-value for overall model = test statistic for b1b1 p-value for the two-tailed test = test statistic for b2b2 p-value for the two-tailed test = What is your conclusion for the overall regression model at the 0.05 alpha level (also called the omnibus test)? The overall regression model is statistically significant at α=0.05α=0.05. The overall…


