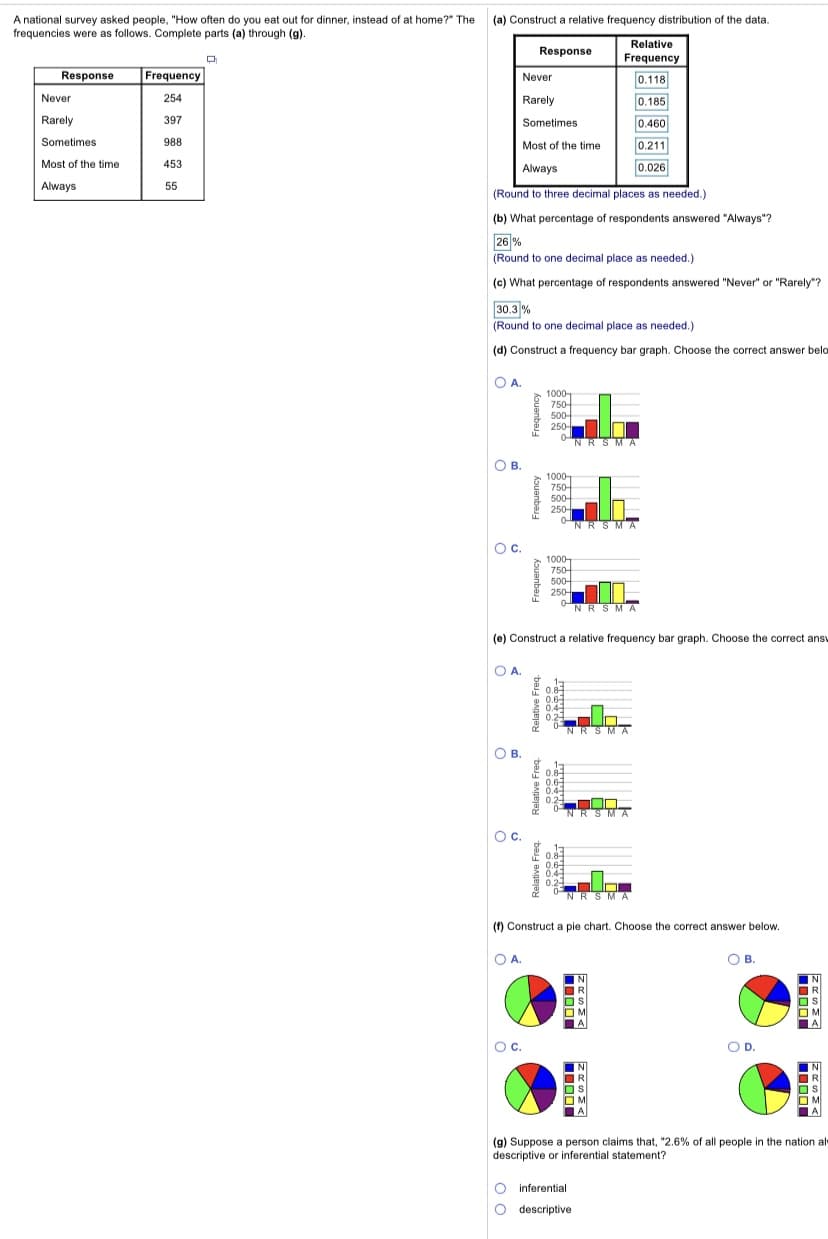
(a) Construct a relative frequency distribution of the data. Relative Response Frequency Never 0.118 Rarely 0.185 Sometimes 0.460 Most of the time Always (Round to three decimal places as needed.) 0.211 0.026 (b) What percentage of respondents answered "Always"? 26 % (Round to one decimal place as needed.) (c) What percentage of respondents answered "Never" or "Rarely"?

Glencoe Algebra 1, Student Edition, 9780079039897, 0079039898, 2018
18th Edition
ISBN:9780079039897
Author:Carter
Publisher:Carter
Chapter10: Statistics
Section10.6: Summarizing Categorical Data
Problem 23PPS
icon
Related questions
icon
Concept explainers
Topic Video
Question
100%
A national survey asked people, "How often do you eat out for dinner, instead of at home?" The (a) Construct a relative frequency distribution of the data.
frequencies were as follows. Complete parts (a) through (g).
Relative
Response
Frequency
Response
Frequency
Never
0.118
Never
254
Rarely
0.185
Rarely
397
Sometimes
0.460
Sometimes
988
Most of the time
0.211
Most of the time
453
Always
0.026
Always
55
(Round to three decimal places as needed.)
(b) What percentage of respondents answered "Always"?
26 %
(Round to one decimal place as needed.)
(c) What percentage of respondents answered "Never" or "Rarely"?
30.3 %
(Round to one decimal place as needed.)
(d) Construct a frequency bar graph. Choose the correct answer belo
OA.
1000-
750-
500
250-
NRSMA
O B
1000-
750-
500-
250-
0N'RSMA
Oc.
1000-
750-
500-
250-
NRSMA
(e) Construct a relative frequency bar graph. Choose the correct answ
O A.
NRSMA
OB.
0.2
NRSMA
Oc.
NRSMA
(f) Construct a pie chart. Choose the correct answer below.
OA.
OB.
O B.
Oc.
Oc.
OD.
(g) Suppose a person claims that, "2.6% of all people in the nation als
descriptive or inferential statement?
inferential
O descriptive
ZRSMA
Kouanbar
Transcribed Image Text:A national survey asked people, "How often do you eat out for dinner, instead of at home?" The (a) Construct a relative frequency distribution of the data. frequencies were as follows. Complete parts (a) through (g). Relative Response Frequency Response Frequency Never 0.118 Never 254 Rarely 0.185 Rarely 397 Sometimes 0.460 Sometimes 988 Most of the time 0.211 Most of the time 453 Always 0.026 Always 55 (Round to three decimal places as needed.) (b) What percentage of respondents answered "Always"? 26 % (Round to one decimal place as needed.) (c) What percentage of respondents answered "Never" or "Rarely"? 30.3 % (Round to one decimal place as needed.) (d) Construct a frequency bar graph. Choose the correct answer belo OA. 1000- 750- 500 250- NRSMA O B 1000- 750- 500- 250- 0N'RSMA Oc. 1000- 750- 500- 250- NRSMA (e) Construct a relative frequency bar graph. Choose the correct answ O A. NRSMA OB. 0.2 NRSMA Oc. NRSMA (f) Construct a pie chart. Choose the correct answer below. OA. OB. O B. Oc. Oc. OD. (g) Suppose a person claims that, "2.6% of all people in the nation als descriptive or inferential statement? inferential O descriptive ZRSMA Kouanbar
Expert Solution
Step 1

NOTE: Since you have posted a question with multiple sub-parts, we will solve first three sub-
parts for you. To get remaining sub-part solved please repost the complete question and
mention the sub-parts to be solved.

Given:

Response Frequency
Never 254
Rarely 397
Sometimes 988
Most of the time 453
Always 55
trending now

Trending now

This is a popular solution!

steps

Step by step

Solved in 3 steps

Blurred answer
Knowledge Booster
Centre, Spread, and Shape of a Distribution
Learn more about
Need a deep-dive on the concept behind this application? Look no further. Learn more about this topic, statistics and related others by exploring similar questions and additional content below.
Recommended textbooks for you
Glencoe Algebra 1, Student Edition, 9780079039897…
Algebra
ISBN:
9780079039897
Author:
Carter
Publisher:
McGraw Hill