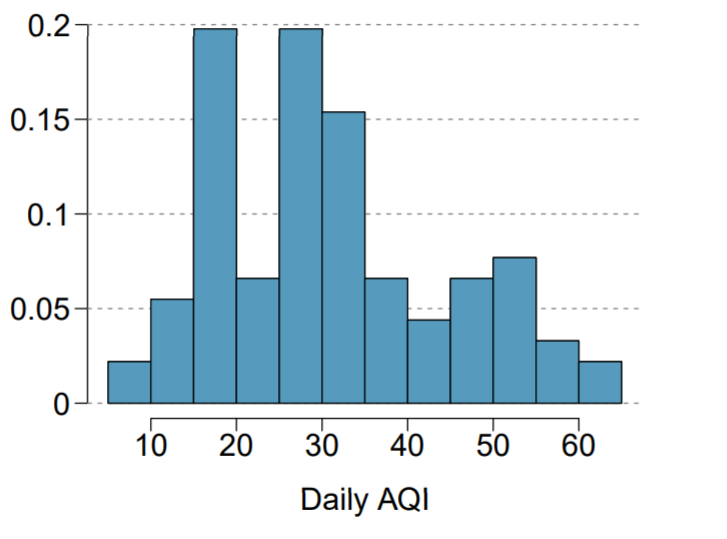
Daily air quality is measured by the air quality index (AQI) reported by the Environmental Protection Agency. This index reports the pollution level and what associated health effects might be a concern. The index is calculated for five major air pollutants regulated by the Clean Air Act and takes values from 0 to 300, where a higher value indicates lower air quality. AQI was reported for a sample of 91 days in 2011 in Durham, NC. The relative frequency histogram below shows the distribution of the AQI values on these days.16 (Please view attached image) (a) Estimate the median AQI value of this sample. (b) Would you expect the mean AQI value of this sample to be higher or lower than the median? Explain your reasoning. (c) Estimate Q1, Q3, and IQR for the distribution. (d) Would any of the days in this sample be considered to have an unusually low or high AQI? Explain your reasoning.


Daily air quality is measured by the air quality index (AQI) reported by the Environmental Protection Agency. This index reports the pollution level and what associated health effects might be a concern. The index is calculated for five major air pollutants regulated by the Clean Air Act and takes values from 0 to 300, where a higher value indicates lower air quality. AQI was reported for a sample of 91 days in 2011 in Durham, NC. The relative frequency histogram below shows the distribution of the AQI values on these days.16
(Please view attached image)
(a) Estimate the median AQI value of this sample.
(b) Would you expect the
to be higher or lower than the median? Explain your
reasoning.
(c) Estimate Q1, Q3, and IQR for the distribution.
(d) Would any of the days in this sample be considered
to have an unusually low or high AQI? Explain your
reasoning.


Trending now
This is a popular solution!

Step by step
Solved in 2 steps


