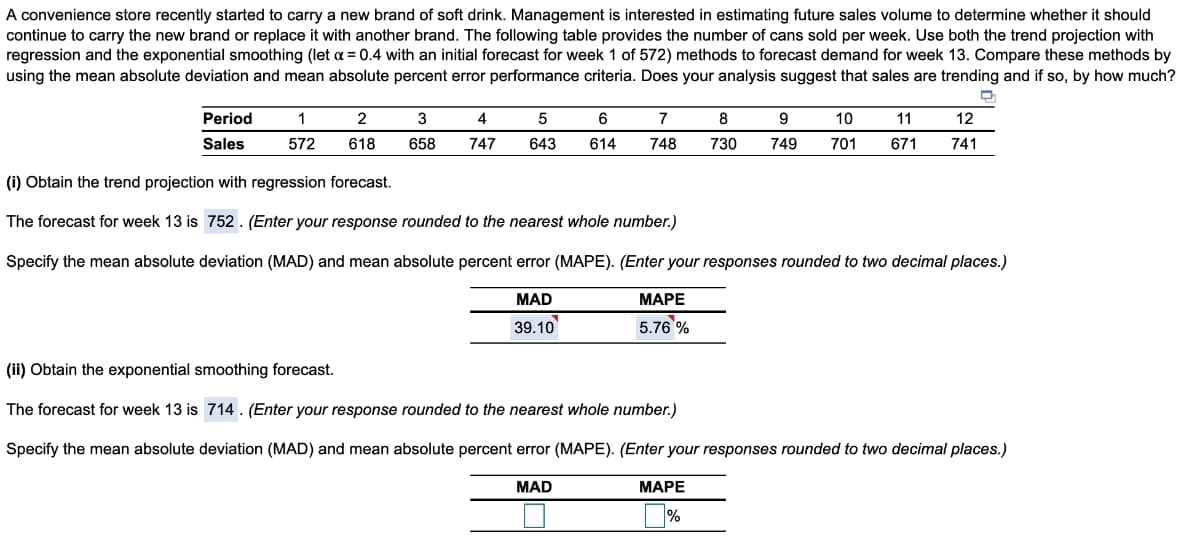
A convenience store recently started to carry a new brand of soft drink. Management is interested in estimating future sales volume to determine whether it should continue to carry the new brand or replace it with another brand. The following table provides the number of cans sold per week. Use both the trend projection with regression and the exponential smoothing (let a = 0.4 with an initial forecast for week 1 of 572) methods to forecast demand for week 13. Compare these methods by using the mean absolute deviation and mean absolute percent error performance criteria. Does your analysis suggest that sales are trending and if so, by how much? Period 1 2 3 4 6 7 8 9 10 11 12 Sales 572 618 658 747 643 614 748 730 749 701 671 741 (i) Obtain the trend projection with regression forecast. The forecast for week 13 is 752. (Enter your response rounded to the nearest whole number.) Specify the mean absolute deviation (MAD) and mean absolute percent error (MAPE). (Enter your responses rounded to two decimal places.)
A convenience store recently started to carry a new brand of soft drink. Management is interested in estimating future sales volume to determine whether it should continue to carry the new brand or replace it with another brand. The following table provides the number of cans sold per week. Use both the trend projection with regression and the exponential smoothing (let a = 0.4 with an initial forecast for week 1 of 572) methods to forecast demand for week 13. Compare these methods by using the mean absolute deviation and mean absolute percent error performance criteria. Does your analysis suggest that sales are trending and if so, by how much? Period 1 2 3 4 6 7 8 9 10 11 12 Sales 572 618 658 747 643 614 748 730 749 701 671 741 (i) Obtain the trend projection with regression forecast. The forecast for week 13 is 752. (Enter your response rounded to the nearest whole number.) Specify the mean absolute deviation (MAD) and mean absolute percent error (MAPE). (Enter your responses rounded to two decimal places.)

Chapter6: Exponential And Logarithmic Functions
Section6.8: Fitting Exponential Models To Data
Problem 3TI: Table 6 shows the population, in thousands, of harbor seals in the Wadden Sea over the years 1997 to...

Related questions
Question
Transcribed Image Text:A convenience store recently started to carry a new brand of soft drink. Management is interested in estimating future sales volume to determine whether it should
continue to carry the new brand or replace it with another brand. The following table provides the number of cans sold per week. Use both the trend projection with
regression and the exponential smoothing (let a = 0.4 with an initial forecast for week 1 of 572) methods to forecast demand for week 13. Compare these methods by
using the mean absolute deviation and mean absolute percent error performance criteria. Does your analysis suggest that sales are trending and if so, by how much?
Period
1
2
3
4
7
8
9
10
11
12
Sales
572
618
658
747
643
614
748
730
749
701
671
741
(i) Obtain the trend projection with regression forecast.
The forecast for week 13 is 752. (Enter your response rounded to the nearest whole number.)
Specify the mean absolute deviation (MAD) and mean absolute percent error (MAPE). (Enter your responses rounded to two decimal places.)
MAD
МАРЕ
39.10
5.76 %
(ii) Obtain the exponential smoothing forecast.
The forecast for week 13 is 714 . (Enter your response rounded to the nearest whole number.)
Specify the mean absolute deviation (MAD) and mean absolute percent error (MAPE). (Enter your responses rounded to two decimal places.)
MAD
МАРЕ
%
Expert Solution
This question has been solved!
Explore an expertly crafted, step-by-step solution for a thorough understanding of key concepts.

This is a popular solution!

Trending now
This is a popular solution!

Step by step
Solved in 3 steps with 1 images

Knowledge Booster


Learn more about
Need a deep-dive on the concept behind this application? Look no further. Learn more about this topic, statistics and related others by exploring similar questions and additional content below.Recommended textbooks for you

College Algebra (MindTap Course List)
Algebra
ISBN:
9781305652231
Author:
R. David Gustafson, Jeff Hughes
Publisher:
Cengage Learning

Algebra & Trigonometry with Analytic Geometry
Algebra
ISBN:
9781133382119
Author:
Swokowski
Publisher:
Cengage
College Algebra (MindTap Course List)
Algebra
ISBN:
9781305652231
Author:
R. David Gustafson, Jeff Hughes
Publisher:
Cengage Learning
Algebra & Trigonometry with Analytic Geometry
Algebra
ISBN:
9781133382119
Author:
Swokowski
Publisher:
Cengage

Trigonometry (MindTap Course List)
Trigonometry
ISBN:
9781337278461
Author:
Ron Larson
Publisher:
Cengage Learning
