
MATLAB: An Introduction with Applications
6th Edition
ISBN: 9781119256830
Author: Amos Gilat
Publisher: John Wiley & Sons Inc
expand_more
expand_more
format_list_bulleted
Related questions
Question
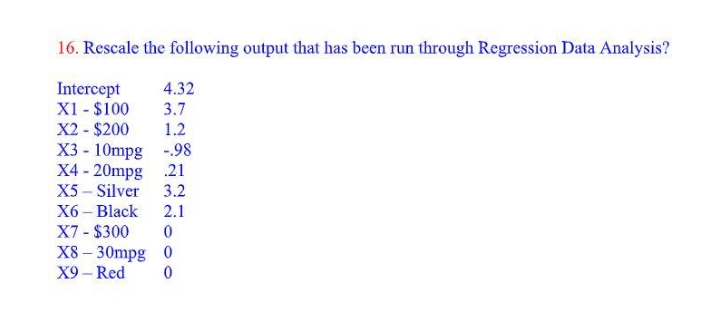

Transcribed Image Text:16. Rescale the following output that has been run through Regression Data Analysis?
Intercept
X1 - $100
4.32
3.7
X2 - $200
X3 - 10mpg -98
X4 - 20mpg .21
X5 – Silver 3.2
1.2
X6 – Black
2.1
X7 - $300
X8 – 30mpg 0
X9 – Red
Expert Solution
This question has been solved!
Explore an expertly crafted, step-by-step solution for a thorough understanding of key concepts.

This is a popular solution

Trending nowThis is a popular solution!

Step by stepSolved in 3 steps

Knowledge Booster

Similar questions
- • When fitting a linear regression, multiple regression lines may be equally as good to represent the data. True O Falsearrow_forwardA logistic regression was used to investigate obesity and poor physical health while controlling for the following variables: age, gender, race, income, health status, education, current smoker, and diet/exercise status. Justify the use of a logistic regression.arrow_forwardCan brand, battery life, and internal storage capacity affect a smartphone's price? Use MegaStat and α = .05 to perform a regression analysis for the Smartphones01BS dataset and answer the following questions. When you copy and paste output from MegaStat to answer a question, remember to choose to "Keep Formatting" to paste the text.arrow_forward
- I was wondering specifically about part D and how to interpret my findings.arrow_forwardA high R2 is all that is needed to determine if a regression is a good model of a causal process. A. True B. Falsearrow_forwardBriefly describe what is meant by the problem of errors in measurement of the predictor variables and describe its effect on a regression analysis.arrow_forward
- Explain what a residual is and how this relates to the best-fit regression model.arrow_forwardDevelop a scatterplot and explore the correlation between customer age and net sales by each type of customer (regular/promotion). Use the horizontal axis for the customer age to graph. Find the linear regression line that models the data by each type of customer. Round the rate of changes (slopes) to two decimal places and interpret them in terms of the relation between the change in age and the change in net sales. What can you conclude? Hint: Rate of Change = Vertical Change / Horizontal Change = Change in y / Change in xarrow_forwardUsing your dataset, run a regression of Y=GPA and X=# Friends.(do not need your actual data, just the regression results)a) State what this regression is attempting to analyze. “By running this regression, we areattempting to show.....”b) Write out the regression equation and describe what it shows (if Friends increase by 1, then. . . ).c) Find your hypothesized GPA when the # friends equals 17.d) Is the slope of # of Friends significantly different from zero?Include Ho, Ha, decision rule, t statistic from table, tc, decision, and conclusion.e) Is the r-squared of # of Friends significantly different from zero?Include Ho, Ha, decision rule, F statistic from table, Fc, decision, and conclusion.arrow_forward
- Explain the process of Computing the Regression Line?arrow_forwardIs it reasonable to interpret the y-intercept of the regression line? Why or why not? One home that is 1,750 square feet is listed at $590,000. Is this home's price above or below average for a home of this size? Use residuals and show your work to answer. footaget) ## (Intercept) 21.14411 136.31449 0.155 0.87954 ## footage 0.28388 0.08516 3.333 0.00667 ** ## Residual standard error: 71.64 on 11 degrees of freedom ## Multiple R-squared: 0.5025, Adjusted R-squared: 0.4573 ## F-statistic: 11.11 on 1 and 11 DF, p-value: 0.006671arrow_forward
arrow_back_ios
arrow_forward_ios
Recommended textbooks for you
- MATLAB: An Introduction with ApplicationsStatisticsISBN:9781119256830Author:Amos GilatPublisher:John Wiley & Sons Inc
 Probability and Statistics for Engineering and th...StatisticsISBN:9781305251809Author:Jay L. DevorePublisher:Cengage Learning
 Statistics for The Behavioral Sciences (MindTap C...StatisticsISBN:9781305504912Author:Frederick J Gravetter, Larry B. WallnauPublisher:Cengage Learning
  Elementary Statistics: Picturing the World (7th E...StatisticsISBN:9780134683416Author:Ron Larson, Betsy FarberPublisher:PEARSON
 The Basic Practice of StatisticsStatisticsISBN:9781319042578Author:David S. Moore, William I. Notz, Michael A. FlignerPublisher:W. H. Freeman
 Introduction to the Practice of StatisticsStatisticsISBN:9781319013387Author:David S. Moore, George P. McCabe, Bruce A. CraigPublisher:W. H. Freeman
MATLAB: An Introduction with Applications
Statistics
ISBN:9781119256830
Author:Amos Gilat
Publisher:John Wiley & Sons Inc
Probability and Statistics for Engineering and th...
Statistics
ISBN:9781305251809
Author:Jay L. Devore
Publisher:Cengage Learning
Statistics for The Behavioral Sciences (MindTap C...
Statistics
ISBN:9781305504912
Author:Frederick J Gravetter, Larry B. Wallnau
Publisher:Cengage Learning
Elementary Statistics: Picturing the World (7th E...
Statistics
ISBN:9780134683416
Author:Ron Larson, Betsy Farber
Publisher:PEARSON
The Basic Practice of Statistics
Statistics
ISBN:9781319042578
Author:David S. Moore, William I. Notz, Michael A. Fligner
Publisher:W. H. Freeman
Introduction to the Practice of Statistics
Statistics
ISBN:9781319013387
Author:David S. Moore, George P. McCabe, Bruce A. Craig
Publisher:W. H. Freeman