A dete set includes data bom student evaloations of courses The summary statistics are n 92. x 3.93, s-0.62 Lsa a 0.05 sigralicance level to test the claim that the population of student course evakations mean oqual te 00 selected ideobly the mal and oltermatve hypotheses, test statistic. P-value, and state the Bnal conclusion that addresses the original claim What t and altemative hypothesas? OB. H 4 00 H, p-4 00 OD. H p00 H, p>4 00 CA H4 00 H pea00 OC H 4 00 Hy 400 Datermine the test statistic Round to twe decimal places as needed) Deternine the P.value Round lo thvee decimal places as needed) Stale the dnal conclunion that addressos the original claim. comect There is evidence to conclude that the original claim that the mean of the population of student course evaluations is equal to 4 00
A dete set includes data bom student evaloations of courses The summary statistics are n 92. x 3.93, s-0.62 Lsa a 0.05 sigralicance level to test the claim that the population of student course evakations mean oqual te 00 selected ideobly the mal and oltermatve hypotheses, test statistic. P-value, and state the Bnal conclusion that addresses the original claim What t and altemative hypothesas? OB. H 4 00 H, p-4 00 OD. H p00 H, p>4 00 CA H4 00 H pea00 OC H 4 00 Hy 400 Datermine the test statistic Round to twe decimal places as needed) Deternine the P.value Round lo thvee decimal places as needed) Stale the dnal conclunion that addressos the original claim. comect There is evidence to conclude that the original claim that the mean of the population of student course evaluations is equal to 4 00

Glencoe Algebra 1, Student Edition, 9780079039897, 0079039898, 2018
18th Edition
ISBN:9780079039897
Author:Carter
Publisher:Carter
Chapter10: Statistics
Section10.5: Comparing Sets Of Data
Problem 3BGP

Related questions

Concept explainers
Contingency Table
A contingency table can be defined as the visual representation of the relationship between two or more categorical variables that can be evaluated and registered. It is a categorical version of the scatterplot, which is used to investigate the linear relationship between two variables. A contingency table is indeed a type of frequency distribution table that displays two variables at the same time.
Binomial Distribution
Binomial is an algebraic expression of the sum or the difference of two terms. Before knowing about binomial distribution, we must know about the binomial theorem.
Topic Video
Question
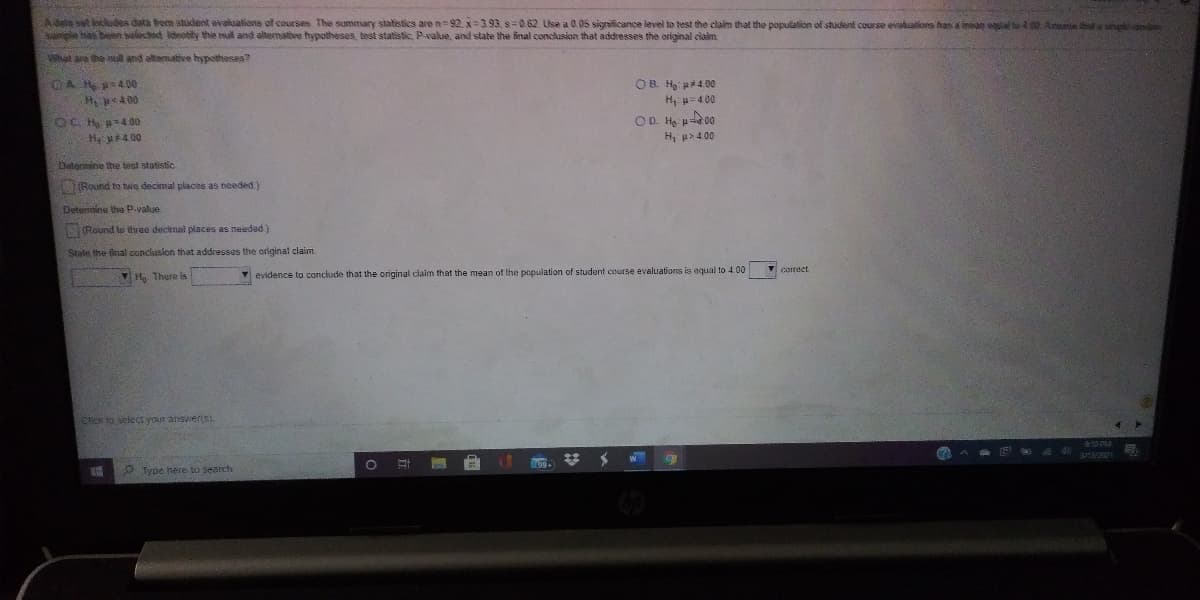
Transcribed Image Text:Adala set includes data bom student evaluations of courses. The summary statistics are n 92. x=3.93, s0.62 Use a 0.05 significance level to test the claim that the population of student course evaluations has a meag qual b00 Asuetaplapdn
sample has been selectet deotity the al and altermative hypotheses, test statistic, P-value, and state the final conclusion that addresses the original ciaim
What are the nul and altamative hypotheses?
OB. Ha a4 00
H, p=4 00
H pe400
OD H p00
OC H =400
H 400
H, a> 4 00
Datermine the test statistic
(Round to two decimal places as needed)
Detersnine the P.yalue
1(Round lo three decimal places as needed)
State the final conclusion that addresses the original claim.
corect
H, There is
Y evidence to conclude that the original claim that the mean of the population of student course evaluations is equal to 4.00
Click to select your answers).
Type here to search
Expert Solution
This question has been solved!
Explore an expertly crafted, step-by-step solution for a thorough understanding of key concepts.

Step by step
Solved in 4 steps with 4 images

Knowledge Booster


Learn more about
Need a deep-dive on the concept behind this application? Look no further. Learn more about this topic, statistics and related others by exploring similar questions and additional content below.Recommended textbooks for you
Glencoe Algebra 1, Student Edition, 9780079039897…
Algebra
ISBN:
9780079039897
Author:
Carter
Publisher:
McGraw Hill
Glencoe Algebra 1, Student Edition, 9780079039897…
Algebra
ISBN:
9780079039897
Author:
Carter
Publisher:
McGraw Hill