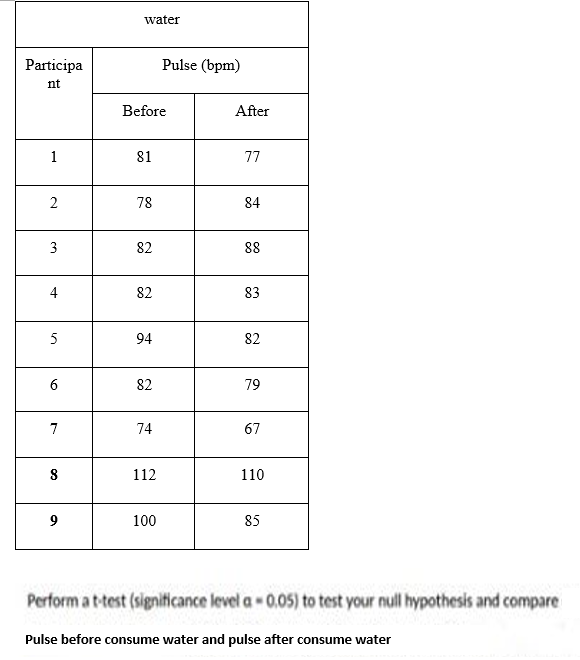
water Participa Pulse (bpm) nt Before After 1 81 77 2 78 84 3 82 88 4 82 83 94 82 6 82 79 7 74 67 112 110 9 100 85 Perform a t-test (signiticance level a 0.05) to test your null hypothesis and compare Pulse before consume water and pulse after consume water in


Q: [item#E2] (refer to the photo below) Which of the two curves exhibits a carrying capacity?
A: Given The graph is as follows:
Q: We estimate a simple regression Grade-B,+B,Effort + u where the red line represents Qur estimate for...
A: Given regression modelGrade=β0+β1Effort+u
Q: Sallup poll in 2018 showed that 46% of US adults say they will not have enough money in their retire...
A: Solution: Given information: p^= 0.46 Sample proportion in 2018p^= 0.42 Sample proportion in 2017E...
Q: if Y1 and Y2 are independent Poisson random variable with parameters λ1 and λ2 re- spectively. Then...
A:
Q: 1. Define rectangular distribution. Find its mean and variance. nned with CamScanner
A: Rectangular distribution or uniform distribution is. Probability density function (pdf) f(x) = 1/(b...
Q: Show the complete solution. A university dean wishes to estimate the average number of hours his par...
A: Given that Population standard deviation =2.6 Margin of error =E =1 99% confidence.
Q: Suppose that the Department of Statistics in CLSU was given slots to send 3 students to an Internati...
A:
Q: Question Recent studies have shown that Punica granatum (or pomegranate) seeds have germination time...
A: Given that the 90 percent confidence interval is 17.44249, 18.44451. It means that we're 90% confide...
Q: Suppose that the random variable X has the discrete uniform distribution S 114, x = 4, 5, 6, 7. f(x)...
A: P(X>5.7)= ?
Q: within six years. Is this percent smaller than for students who play intramural sports? 155 of the 2...
A:
Q: х y 0.5 0.5040 0.5156 5 0.5257 7 0.5365 Find the exponential regression curve and the standard devia...
A: Exponential regression equation is given by y= a*(b)x log(y)= log(a)+x*log(b) Y= A+BX log(y)= Y, log...
Q: Gold Silver Boys Girls 3 6. 9. A student is randomly selected. Find the probability (in exact fracti...
A: Gold Silver Bronze Total Boys 3 7 5 15 Girls 6 2 9 17 Total 9 9 14 32
Q: ABC, Inc., sells tea products to various customers. In recent years, profits have been declining. Th...
A: The coefficient of determination is a statistical scale that examines how differences in one variabl...
Q: The mean of the sampling distribution of sample means is equal to the population mean. Justify why t...
A:
Q: Employees of a local college have been classified according to gender and job type. Gender Job...
A:
Q: Based on the slot machine shown to the right, in how many ways can we obtain oranges on all three wh...
A:
Q: You'd like to test the null hypothesis that the means of the two samples (column A and column B) are...
A: There are two independent samples which follows normal distribution. We have to test whether the mea...
Q: Seventy million pounds of trout are grown in the U.S. every year. Farm-raised trout contain an avera...
A: The random variable X follows normal distribution. We have to find the probability of observing a sa...
Q: In a survey of women in a certain country (ages 20 - 29), the mean height was 62.6 inches with (a) W...
A:
Q: Surgical wounds heal more slowly in people who are stressed. Ten nursing students were given punctur...
A: Given that Data : 5 6 6 8 9 7 8 10 9 10 We have to find Sample Mean and Sample standard deviatio...
Q: #3. A member of the Santa Cruz, California business community wants to know if local employees take ...
A: T test is used to measure the mean significant relationship between the sample and population. It is...
Q: Please use the accompanying Excel data set or accompanying Text file data set when completing the fo...
A:
Q: Suppose that the sitting back-to-knee length for a group of adults has a normal distribution with a ...
A:
Q: For a large, top-rated corporation, 99% of employees said the corporation is a g Let p represent the...
A: A random sample of 8 employees given hence n=8 99% employees said the corporation is a great place t...
Q: I collected two samples of data, and found that the assumption of homogeneity of variance was violat...
A: Given information: s1=10, n1=35s2=45, n2=35
Q: A technician collected the following data after measuring the heights of a sample of plants that wer...
A: The data of 12 observations of height of plants is given. The observations are 15.5, 15.6, 12.9, 20....
Q: fomotive center guarantees customers that the service will take no longer than 20 minutes. If it doe...
A: Given: μ=17σ=2.5
Q: You have set a professional goal to become the head of your workplace’s Party Planning Committee. Y...
A: Given that Sample size n =47 Favorable cases x =34 Sample proportion p^=x/n =34/47 =0.7234
Q: The estimated GARCH volatility model parameters and t-statistics are given below. Volatility Predict...
A:
Q: Assume a dependent variable y is related to an independent variables x, and x, by the following line...
A: Introduction: The dependent variable is y, and the independent variables are x1 and x2. Denote the p...
Q: Zach makes the minimum salary for an Actuary. Russell makes the median salary for a CPA. Who makes m...
A: Here use basic of box plot representation of data
Q: Only 11% of registered voters voted in the last election. Will voter participation change for the up...
A: Given,n=379x=34p^=xnp^=34379=0.0897α=0.05
Q: The Indian River County Health Department needs to estimate the proportion of all children in the co...
A: 1) It is given that n=116 and the sample proportion is 0.74.
Q: Let X = Red blood cell count in millions per cubic millimeter of whole blood for healthy females ex ...
A:
Q: THEOREM 3.3. If X EXP (^,), Y` EXP 2), X and Yare in- dependent, and A + A2, then Z = X + Y has a tw...
A:
Q: 1. 250 Academic Strand Students 2. 418 Grade 11 Students 3. 686 Grade 12 Students
A: Since you posted a question with multiple subparts, we will solve first three subparts for you. To g...
Q: 8. Define Cauchy distribution. Find its characteristic function.
A:
Q: Illustration 9.20. The following Table shows the distribution of- 105 families according to their ex...
A:
Q: Determine the given in each problem and solve for the statistical value z. 1. It was found on a stu...
A: As per our guidelines we are supposed to answer only one question per post so i am solving first que...
Q: Answer the following problems with random samples taken from the normal population (The choices are...
A: Note: According to bartleby experts question answers guidelines an expert can solve only first quest...
Q: 5. If there are 13 people and only 6 chairs are available. In how many ways they can be seated? A. 1...
A: The number of people is 13 and the number of chairs available is 6.
Q: Professor Piraneo has three classes with 80 students total. He created a distribution for mid-term ...
A: Given information:- a) The distribution for mid-term scores is given as, Score No. of student...
Q: Q1 Ken is a sports teacher in a college and he wants to examine whether there is any difference in t...
A: Sample size = Number of students = 12 Significance level = 0.05
Q: 2.3
A: As per guidelines expert have to answer first question only dear student please upload other questio...
Q: The weenay demand for petroeum of a 1ocal gas stanion in thourana itens ie given by: flo) = 48 ( x-)...
A: Given: X is the demand of gas per week in 000 fx=48×x-0.51-x 0.5<x<1
Q: Let X be a random variable with p.d.f f(x) x = 1,2,3, ... .Find the mode. 2,4 1,3 1,2 2,3
A:
Q: [item#D8] (refer to the photo below) Are predator-prey relationships density-dependent or density-in...
A: Given The graph is as follows:
Q: PART II Identify a product available in your home. Measure the weight (g) or length (cm) of at least...
A: Hypothesis testing : Hypothesis testing is a type of statistical inference that uses sample data to ...
Q: Find the 98% confidence interval for the cigarette tax in all 50 states.
A: Here use given sample data And here population size is Finite N= 50
Q: Exercise 5.20 Consider the following portfolio of annuities-due currently being paid from the assets...
A:

Step by step
Solved in 3 steps with 2 images

- All Fresh Seafood is a wholesale fish company based on the east coast of the U.S. Catalina Offshore Products is a wholesale fish company based on the west coast of the U.S. Table #9.2.5 contains prices from both companies for specific fish types ("Seafood online," 2013) ("Buy sushi grade," 2013). Do the data provide enough evidence to show that a west coast fish wholesaler is more expensive than an east coast wholesaler? Test at the 5% level. (Show work) Table #9.2.5: Wholesale Prices of Fish in Dollars Fish All Fresh Seafood Prices Catalina Offshore Products Prices Cod 19.99 17.99 Tilapi 6.00 13.99 Farmed Salmon 19.99 22.99 Organic Salmon 24.99 24.99 Grouper Fillet 29.99 19.99 Tuna 28.99 31.99 Swordfish 23.99 23.99 Sea Bass 32.99 23.99 Striped Bass 29.99 14.99Nutritional researchers conducted an investigation of two high-fiber diets intended to reduce cholesterol level. a group of people with high cholesterol were randomly selected to receive an "rice" diet or a "vegetable" diet for 20 days. Use a t-test to compare the diets at 5% significance level. Null Hypothesis: The means from two respective diets are the same Alternative Hypothesis: The means from the two diets differ. Fall in Cholesterol (mg/dL) Diet n Mean SD Rice 10 14.4 6.8 Vegetable 9 10.57 6.37 do we fail to reject the null hypothesis or reject null hypothesisA common symptom of otitis media in young children is the prolonged presence of fluid in the middle ear, known as middle-ear effusion. The presence of fluid may result in temporary hearing loss and interfere with normal learning skills in the first 2 years of life. One hypothesis is that babies who are breastfed for at least 1 month build up some immunityagainst the effects of the infection and have less prolonged effusion than do bottle-fed babies. A small study of 24 pairs of babies is set up, in which the babies are matched on a one-to-one basis according to age, sex, socioeconomic status, and type of medications taken. One member of the matched pair is a breastfed baby, and the other member is a bottle-fed baby. The outcome variable is the duration of middle-ear effusion after the first episode of otitis media. The results are given in Table 9.11. A) What hypotheses are being tested here? B) Why might a nonparametric test be useful in testing the hypotheses? C) Which nonparametric…
- a. Why the ANOVA F-test for model utility is called the "global" test? b. Why would it make sense to call the hypothesis test as a marginal or partial test? c. If you are given the ANOVA table, will you be able to calculate R2 and R2a? d. Why R2a≤R2?Cereals, redux We also have data on the protein contentof the cereals in Exercise 19 by their shelf number. Hereare the boxplot and ANOVA table:a) What are the null and alternative hypotheses?b) What does the ANOVA table say about the nullhypothesis? (Be sure to report this in terms ofprotein content and shelves.)c) Can we conclude that cereals on shelf 2 have a lowermean protein content than cereals on shelf 3? Can weconclude that cereals on shelf 2 have a lower meanprotein content than cereals on shelf 1? What can weconclude?d) To check for significant differences between the shelfmeans we can use a Bonferroni test, whose results areshown below. For each pair of shelves, the differenceis shown along with its standard error and significancelevel. What does it say about the questions in part c?Dependent Variable: PROTEIN(I)Shelf(J)ShelfMeanDifference(I-J)Std.Error P-Value95%ConfidenceIntervalBonferroni LowerBoundUpperBound1 2 0.75 0.322 0.070 -0.04 1.533 -0.21 0.288 1.000 -0.92 0.492 1…A common symptom of otitis media in young children is the prolonged presence of fluid in the middle ear, known as middle-ear effusion. The presence of fluid may result in temporary hearing loss and interfere with normal learning skills in the first 2 years of life. One hypothesis is that babies who are breastfed for at least 1 month build up some immunity against the effects of the infection and have less prolonged effusion than do bottle-fed babies. A small study of 24 pairs of babies is set up, in which the babies are matched on a one-to-one basis according to age, sex, socioeconomic status, and type of medications taken. One member of the matched pair is a breastfed baby, and the other member is a bottle-fed baby. The outcome variable is the duration of middle-ear effusion after the first episode of otitis media. The results are given in Table 9.11. 9.16 Test the hypothesis that the duration of effusion is different among breastfed babies than among bottle-fed babies using a…
- A common symptom of otitis media in young children is the prolonged presence of fluid in the middle ear, known as middle-ear effusion. The presence of fluid may result in temporary hearing loss and interfere with normal learning skills in the first 2 years of life. One hypothesis is that babies who are breastfed for at least 1 month build up some immunity against the effects of the infection and have less prolonged effusion than do bottle-fed babies. A small study of 24 pairs of babies is set up, in which the babies are matched on a one-to-one basis according to age, sex, socioeconomic status, and type of medications taken. One member of the matched pair is a breastfed baby, and the other member is a bottle-fed baby. The outcome variable is the duration of middle-ear effusion after the first episode of otitis media. The results are given in Table 9.11. 9.13 What hypotheses are being tested here? 9.14 Why might a nonparametric test be useful in testing the hypotheses? 9.15 Which…A common symptom of otitis media in young children is the prolonged presence of fluid in the middle ear, known as middle-ear effusion. The presence of fluid may result in temporary hearing loss and interfere with normal learning skills in the first 2 years of life. One hypothesis is that babies who are breastfed for at least 1 month build up some immunity against the effects of the infection and have less prolonged effusion than do bottle-fed babies. A small study of 24 pairs of babies is set up, in which the babies are matched on a one-to-one basis according to age, sex, socioeconomic status, and type of medications taken. One member of the matched pair is a breastfed baby, and the other member is a bottle-fed baby. The outcome variable is the duration of middle-ear effusion after the first episode of otitis media. The results are given in Table 9.11. 9.13 What hypotheses are being tested here?9.14 Why might a nonparametric test be useful in testing the hypotheses?Exercise A: In building an arena, steel bars with a mean ultimate tensile strength of 400 Megapascal (MPa) with a variance of 81 MPa were delivered by the manufacturer. The project engineer tested 50 steel bars and found out that the mean ultimate tensile strength is 390 MPa. The decision for the extension of the contract with the manufacturer depends on the engineer. Test the hypothesis whether or not there is no significant difference between the two means using a two-tailed test with α = 0.01. What are the appropriate hypotheses for the two-tailed test? What is the test statistic to be used and the reasons for its selection? What is the critical value c? What is the value of the test statistic or the computed value? Formulate a conclusion about the given situation.
- The display provided from technology available below results from using data for a smartphone carrier's data speeds at airports to test the claim that they are from a population having a mean less than 4.00 Mbps. Conduct the hypothesis test using these results. Use a 0.05 significance level. T-Test μ<4.00 t=−0.168791 p=0.433328 x=3.87 Sx=5.446026 n=50 Identify the null and alternative hypotheses, test statistic, P-value, and state the final conclusion that addresses the original claim.Early-Onset Dementia. Dementia is the loss of the intellectual and social abilities severe enough to interfere with judgment, behavior, and daily functioning. Alzheimer’s disease is the most common type of dementia. In the article “Living with Early Onset Dementia: Exploring the Experience and Developing Evidence- Based Guidelines for Practice” (Alzheimer’s Care Quarterly, Vol. 5, Issue 2, pp. 111–122), P. Harris and J. Keady explored the experience and struggles of people diagnosed with dementia and their families. A hypothesis test is to be performed to decide whether the mean age at diagnosis of all people with early-onset dementia is less than 55 years old. a. determine the null hypothesis. b. determine the alternative hypothesis. c. classify the hypothesis test as two tailed, left tailed, or right tailed.A researcher has observed 500 vehicles at a stop sign in a suburban neighbourhood and recorded the type of vehicle (sedan, hatchback, bakkie) and driver behaviour at the stop sign (complete stop, near stop, “ran” the stop sign). At the 0.05 level of significance, could there be some relationship between driver behaviour and the type of vehicle being driven? Define the null hypothesis and the alternative hypothesis. A. H1: Driver’s behaviour and type of vehicle are independent vs H0: A relationship exists between driver’s behaviour and type of vehicle B. H0: A relationship exists between driver’s behaviour and type of vehicle vs H1: No relationship exists between driver’s behaviour and type of vehicle C. H0: Driver’s behaviour and dependent on the type of vehicle vs H1: Driver’s behaviour and type of vehicle are independent D. H0: Driver’s behaviour and type of vehicle are independent vs H1: A relationship exists between driver’s behaviour and type of vehicle


